- Analytics
- Technical Analysis
EUR/ZAR Technical Analysis - EUR/ZAR Trading: 2019-05-27
The South African Central Bank may cut the rate at its next meeting in July
The South African Reserve Bank kept the rate unchanged at its last meeting on May 23, but noted the possibility of its reduction in the future. Will the EURZAR rise?
Such a movement is observed in case of the strengthening of the euro and weakening of the South African rand. The rate of the South African Reserve Bank is 6.75%, which is noticeably higher than the 4.4% inflation. The regulator is considering the possibility of a rate cut in order to maintain the economic growth in South Africa. This can have a negative impact on the exchange rate of the rand. The South African Reserve Bank lowered its forecast for the GDP growth in South Africa in 2019 to 1%, while in January it expected + 1.5%. In turn, the euro strengthened amid the resignation of British Prime Minister Theresa May and the defeat of the Euroskeptics party in Denmark at the European Parliament elections. Amid the worsening of the US-China trade war, the European currency may become more attractive for investors.
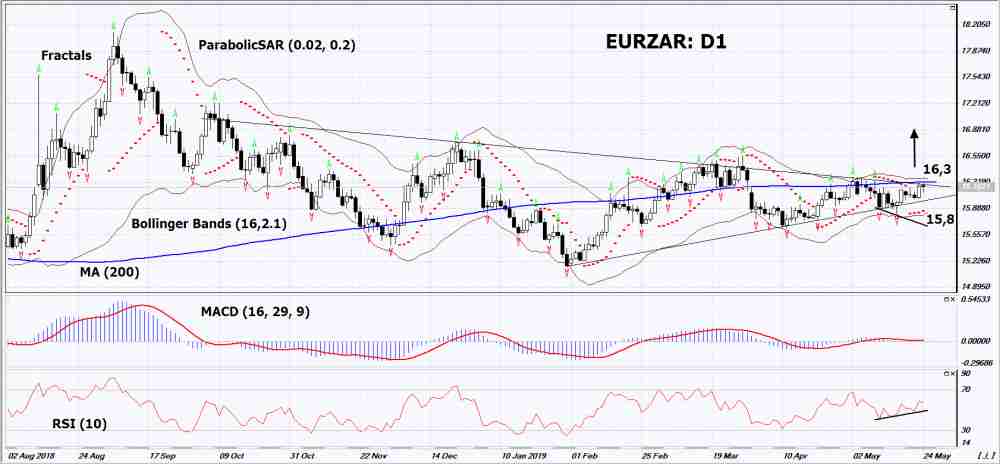
On the daily timeframe, EURZAR: D1 approached the upper boundary of the long-term triangle. Before opening a buy position, it should be breached up. A number of technical analysis indicators formed buy signals. The further price increase is possible in case of a slowdown in the growth of the South African economy and the strengthening euro.
- The Parabolic Indicator gives a bullish signal.
- The Bollinger bands have narrowed, which indicates low volatility. Both Bollinger bands are titled upward.
- The RSI indicator is above 50. It has formed a positive divergence.
- The MACD indicator gives a bullish signal.
The bullish momentum may develop in case EURZAR exceeds the resistance line of the long-term triangle, the two last fractal highs, the 200-day moving average line and the upper Bollinger band at 16.3. This level may serve as an entry point. The initial stop loss may be placed below the last fractal low, the Parabolic signal and the lower Bollinger band at 15.8. After opening the pending order, we shall move the stop to the next fractal low following the Bollinger and Parabolic signals. Thus, we are changing the potential profit/loss to the breakeven point. More risk-averse traders may switch to the 4-hour chart after the trade and place there a stop loss moving it in the direction of the trade. If the price meets the stop level (15.8) without reaching the order (16.3), we recommend to close the position: the market sustains internal changes that were not taken into account.
Summary of technical analysis
| Position | Buy |
| Buy stop | Above 16.3 |
| Stop loss | Below 15.8 |
Explore our
Trading Conditions
- Spreads from 0.0 pip
- 30,000+ Trading Instruments
- Stop Out Level - Only 10%
Ready to Trade?
Open Account Note:
This overview has an informative and tutorial character and is published for free. All the data, included in the overview, are received from public sources, recognized as more or less reliable. Moreover, there is no guarantee that the indicated information is full and precise. Overviews are not updated. The whole information in each overview, including opinion, indicators, charts and anything else, is provided only for familiarization purposes and is not financial advice or а recommendation. The whole text and its any part, as well as the charts cannot be considered as an offer to make a deal with any asset. IFC Markets and its employees under any circumstances are not liable for any action taken by someone else during or after reading the overview.
