- Analytics
- Technical Analysis
Hang Seng Index Technical Analysis - Hang Seng Index Trading: 2017-08-16
Weak economic data were released in China
On Monday and Tuesday, weak economic statistics were published in China. Besides, there remains political tension around North Korea. Will the quotes of the Hong Kong stock index Hang Seng decrease?
On Monday, the industrial production data for July came out in China. Its increase was +6.4%, which is the minimal growth since January of this year. It increased by 7.6% in June and in July it was expected to grow by 7.1%. Market participants negatively perceived the real July data on industrial production. Besides, the growth rate of retail sales slowed down to + 10.4% also in July, compared to an increase by + 11% in June. Another additional negative was the slowdown in the growth rate of private investments in China to + 6.9% from + 7.2% in January-July, 2017. The share of private investments reaches 60% of the total volume. Note that since the beginning of this year, Hang Seng has grown by 23.5% and outperformed the stock indices of the majority of other countries. Among negative political factors, note the US President Donald Trump’s disposal to make enquiry on the alleged theft of the US intellectual property by Chinese companies.
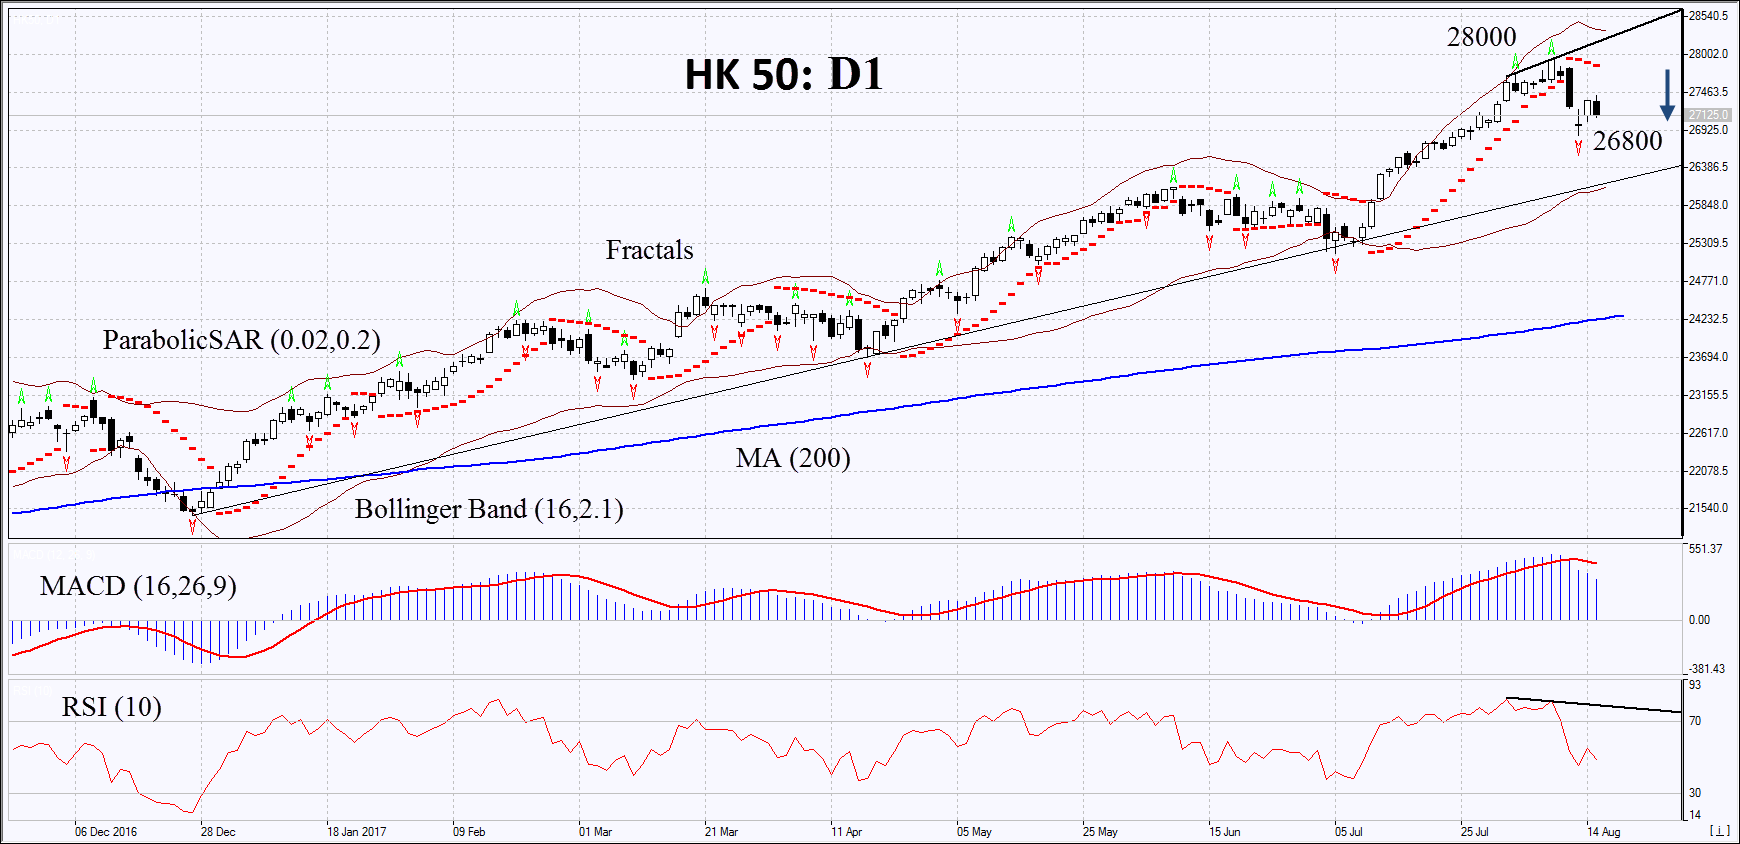
On the daily timeframe, HK50: D1 preserves the rising trend, but is currently dropping to its support line. The full downward correction is possible in case of the publication of negative economic and corporate information in Hong Kong and the escalation of the political situation around North Korea.
- The Parabolic indicator gives a bearish signal.
- The Bollinger bands have widened, which means lower volatility. They are tilted downwards.
- The RSI indicator is below 50. It has formed a negative divergence.
- The MACD indicator gives a bearish signal.
The bearish momentum may develop in case HK50 drops below the last fractal low at 26800. This level may serve as an entry point. The initial stop loss may be placed above the last fractal high, the 2-year high and the Parabolic signal at 28000. After opening the pending order, we shall move the stop to the next fractal high following the Bollinger and Parabolic signals. Thus, we are changing the potential profit/loss to the breakeven point. More risk-averse traders may switch to the 4-hour chart after the trade and place there a stop loss moving it in the direction of the trade. If the price meets the stop level at 28000 without reaching the order at 26800 we recommend cancelling the position: the market sustains internal changes that were not taken into account.
Summary of technical analysis
| Position | Sell |
| Sell stop | below 26800 |
| Stop loss | above 28000 |
Explore our
Trading Conditions
- Spreads from 0.0 pip
- 30,000+ Trading Instruments
- Stop Out Level - Only 10%
Ready to Trade?
Open Account Note:
This overview has an informative and tutorial character and is published for free. All the data, included in the overview, are received from public sources, recognized as more or less reliable. Moreover, there is no guarantee that the indicated information is full and precise. Overviews are not updated. The whole information in each overview, including opinion, indicators, charts and anything else, is provided only for familiarization purposes and is not financial advice or а recommendation. The whole text and its any part, as well as the charts cannot be considered as an offer to make a deal with any asset. IFC Markets and its employees under any circumstances are not liable for any action taken by someone else during or after reading the overview.
