- Analytics
- Technical Analysis
Nikkei Index Technical Analysis - Nikkei Index Trading: 2018-12-20
Widening trade deficit bearish for NIKKEI
Japanese exports slowed in November. Will the NIKKEI continue declining?
Japanese economic data were weak on balance after disappointing Q3 GDP a month ago. The balance of trade turned negative in October, consumer confidence slipped in November, and the latest report by the Ministry of Finance indicated the trade balance deficit widened. The trade deficit rose to 737 billion yen from 450 billion a month ago. This is the fourth deficit in last five months. Japan’s exports slowed sharply due to weakening demand from China: exports rose 0.1% from the same month a year earlier, compared to 8.2% rise in October. Falling trade balance is bearish for NIKKEI.
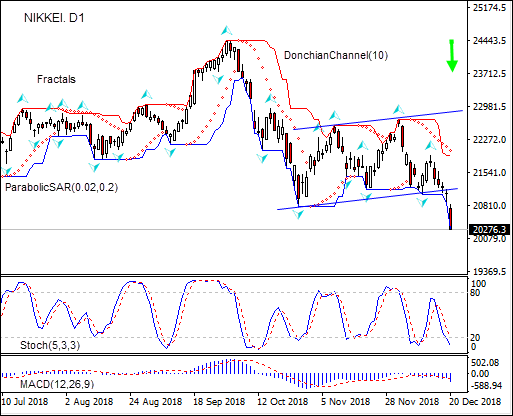
On the daily timeframe the NIKKEI: D1 has breached below the lower boundary of the descending channel.
- The Parabolic indicator gives a sell signal.
- The Donchian channel indicates downtrend: it is widening down.
- The MACD indicator gives a bearish signal: it is below the signal line and the gap is widening.
- The Stochastic oscillator has breached into the oversold zone, this is bullish.
We believe the bearish momentum will continue after the price breaches below the lower boundary of Donchian channel at 20274.50. This level can be used as an entry point for placing a pending order to sell. The stop loss can be placed above the upper Donchian channel at 21902.60. After placing the order, the stop loss is to be moved every day to the next fractal high, following Parabolic signals. Thus, we are changing the expected profit/loss ratio to the breakeven point. If the price meets the stop loss level (21902.60) without reaching the order (20274.50), we recommend cancelling the order: the market has undergone internal changes which were not taken into account.
Technical Analysis Summary
| Position | Sell |
| Sell stop | Below 20274.50 |
| Stop loss | Above 21902.60 |
- Get Certificate

Note:
This overview has an informative and tutorial character and is published for free. All the data, included in the overview, are received from public sources, recognized as more or less reliable. Moreover, there is no guarantee that the indicated information is full and precise. Overviews are not updated. The whole information in each overview, including opinion, indicators, charts and anything else, is provided only for familiarization purposes and is not financial advice or а recommendation. The whole text and its any part, as well as the charts cannot be considered as an offer to make a deal with any asset. IFC Markets and its employees under any circumstances are not liable for any action taken by someone else during or after reading the overview.
