- Analytics
- Technical Analysis
NZD/USD Technical Analysis - NZD/USD Trading: 2017-05-12
New Zealand dollar weakness continues after central bank meeting
The New Zealand dollar has been declining since the end of January. The Reserve Bank of New Zealand didn’t change its rate track projection but lowered estimates for the trade weighted index. Will the New Zealand dollar continue weakening?
The Reserve Bank of New Zealand left the Official Cash Rate at 1.75% at its May 11 meeting, keeping it steady since November 2016. Reserve Bank governor Graeme Wheeler said the recent jump in consumer prices, mainly due to higher tradeables inflation, particularly petrol and food prices, may only be temporary: headline inflation rose to 2.2% in the first three months of the year, well above the RBNZ’s forecast of 1.5%. In February, the Reserve Bank adopted a neutral stance on policy, signaling no hikes until the middle of 2019. Central bank policy statement was deemed dovish, as the central bank signaled no change in rate hike track and cut its projections for the Trade Weighted Index (TWI), a basket of exchange rates for 17 of New Zealand's major trading partners. RBNZ projects the TWI will average 76 in the current June quarter, falling to 75.3 by March next year. The TWI was recently at 74.86. On May 15 first quarter retail sales will be released and on May 25 balance of trade for April will be published.
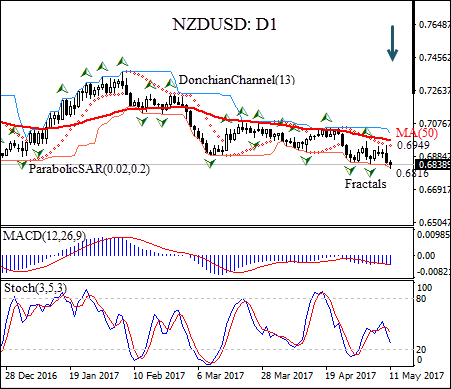
The NZDUSD: D1 has been trading with negative bias since the end of January. The price has fallen below the 50-day moving average MA(50) on the daily chart.
- Parabolic indicator gives a sell signal.
- The Donchian channel indicates downtrend : it is tilted downward.
- The MACD indicator is bearish.
- The stochastic oscillator is falling and hasn’t reached the oversold zone yet.
We believe the bearish momentum will continue after the price closes below the lower Donchian boundary at 0.6816. A pending order to sell can be placed below that level. The stop loss can be placed above the Parabolic signal at 0.6949. After placing the order, the stop loss is to be moved every day to the next fractal high, following Parabolic signals. Thus, we are changing the probable profit/loss ratio to the breakeven point. The most risk-averse traders may switch to the 4-hour chart after the trade and place there a stop-loss moving it in the direction of the trade. If the price meets the stop loss level ($0.6949) without reaching the order ($0.6816), we recommend canceling the position: the market sustains internal changes which were not taken into account.
Technical Analysis Summary
| Position | Sell |
| Sell stop | Below 0.6816 |
| Stop loss | Above 0.6949 |
Explore our
Trading Conditions
- Spreads from 0.0 pip
- 30,000+ Trading Instruments
- Stop Out Level - Only 10%
Ready to Trade?
Open Account Note:
This overview has an informative and tutorial character and is published for free. All the data, included in the overview, are received from public sources, recognized as more or less reliable. Moreover, there is no guarantee that the indicated information is full and precise. Overviews are not updated. The whole information in each overview, including opinion, indicators, charts and anything else, is provided only for familiarization purposes and is not financial advice or а recommendation. The whole text and its any part, as well as the charts cannot be considered as an offer to make a deal with any asset. IFC Markets and its employees under any circumstances are not liable for any action taken by someone else during or after reading the overview.
