- Analytics
- Technical Analysis
WTI Crude Technical Analysis - WTI Crude Trading: 2016-10-25
Iraq opposes oil production freeze by OPEC
The cost of US WTI fell after Iraq said it is unwilling to cut of freeze oil production. Will WTI prices continue falling?
In the end of September OPEC countries have reached the preliminary agreement on oil output freeze. The final decision shall be taken at the official OPEC meeting on November 30, 2016. Meanwhile, Oil minister of Iraq Jabbar al-Luaibi said on Sunday the country needs more funds to finance military costs. In theory, Iraq may increase oil production to 9mln barrels a day from 4.77mln in September. This contradicts the OPEC plans to cut production to 33-32.5mln barrels a day as early as in December from current 33.4mln barrels a day. Iraq ranks 2nd after Saudi Arabia by oil output volumes among OPEC members. Its position may hinder the output cuts in OPEC. WTI prices fell moderately on Monday on expectations of further 1mln barrel decline in oil stockpiles in US Cushing terminal in a week to October 21, according to Genscape consultancy. The official data on US stockpiles will come out on Wednesday. If the expected decline does not happen, the oil prices may continue falling.
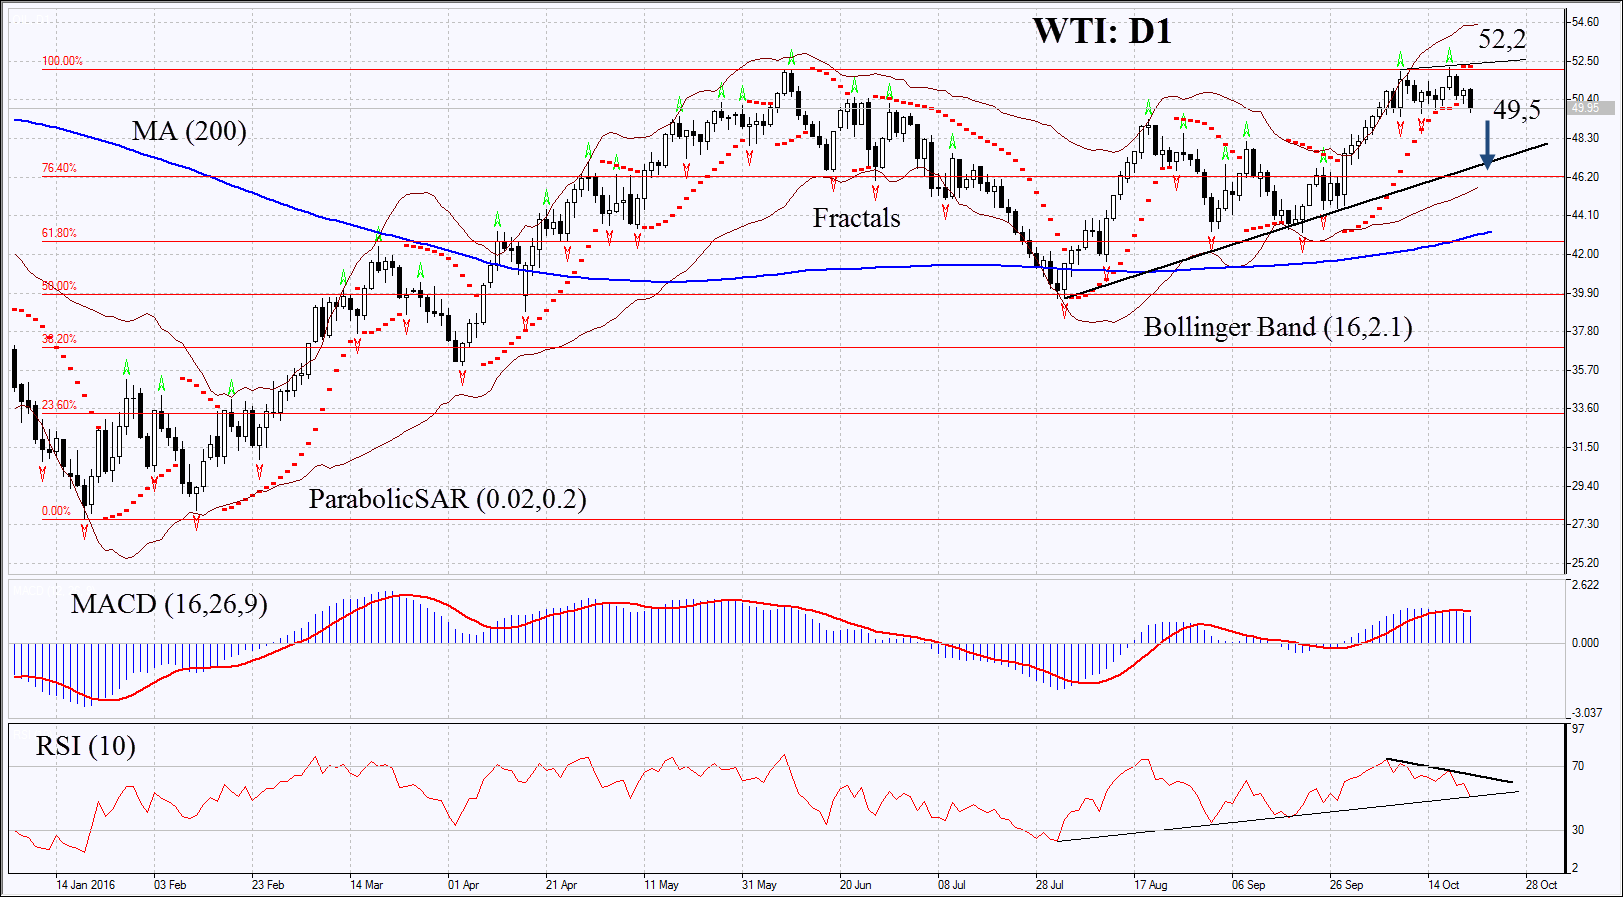
On the daily chart OIL: D1 has been consolidating in a narrow range for 3 weeks already. Last week it hit a fresh year high but now has already come close to the lower boundary of the range. Further decline is possible in case the data on Wednesday show less significant gas decline in US gas stockpiles than markets expect. Moreover, oil prices may decline in case politicians in Iraq express their will to increase or support current level of oil production.
- Parabolic indicator is giving bearish signals.
- Bollinger bands have widened a lot which means higher volatility.
- RSI is above 50 having formed negative divergence.
- MACD is giving bearish signals.
The bearish momentum may develop in case OIL price falls below the two last fractal lows at 49.5. This level may serve the point of entry. The initial stop-loss may be placed above the Parabolic signal, the year high and the last fractal high at 52.2. Having opened the pending order we shall move the stop to the next fractal high following the Parabolic and Bollinger signals. Thus, we are changing the probable profit/loss ratio to the breakeven point. The most risk-averse traders may switch to the 4-hour chart after the trade and place there a stop-loss moving it in the direction of the trade. If the price meets the stop-loss level at 52.2 without reaching the order at 49.5, we recommend cancelling the position: the market sustains internal changes which were not taken into account.
Summary of technical analysis
| Position | Sell |
| Sell stop | below 49.5 |
| Stop loss | above 52.2 |
Explore our
Trading Conditions
- Spreads from 0.0 pip
- 30,000+ Trading Instruments
- Stop Out Level - Only 10%
Ready to Trade?
Open Account Note:
This overview has an informative and tutorial character and is published for free. All the data, included in the overview, are received from public sources, recognized as more or less reliable. Moreover, there is no guarantee that the indicated information is full and precise. Overviews are not updated. The whole information in each overview, including opinion, indicators, charts and anything else, is provided only for familiarization purposes and is not financial advice or а recommendation. The whole text and its any part, as well as the charts cannot be considered as an offer to make a deal with any asset. IFC Markets and its employees under any circumstances are not liable for any action taken by someone else during or after reading the overview.
