- Analytics
- Technical Analysis
USD/DKK Technical Analysis - USD/DKK Trading: 2017-10-03
The negative rate policy may continue for a long time
Danish Central Bank Governor Lars Rohd said that the rate growth is possible only in case of noticeable improvement in the country’s economic situation. He also added that he did not consider the rise in property prices by 10% per year to be a "housing bubble". Will the Danish krone continue weakening against the US dollar?
Denmark has had a negative rate the longest in Europe, since 2012, which currently is minus 0.75%. At the same time, the September inflation was 1.5%. Note that according to the European Union's Exchange Rate Mechanism (ERM2), the rate of the Danish krone should be in the range of 7.46038 krones per euro, plus or minus 2.25%. Currently it is 7.443. In the 2nd quarter of 2017, Denmark's GDP grew by 2.71% in annual terms, which has been the usual level in the last few years. The Danish Central Bank expects an economic growth of 2.3% this year and of 1.8% in 2018. Negative rates may continue until 2020. Theoretically, the development of negative trends in the EU may have a more impact on the Danish krone than on the euro. Note that the euro is falling on the background of the events in Spain after the referendum on the Catalonia independence.
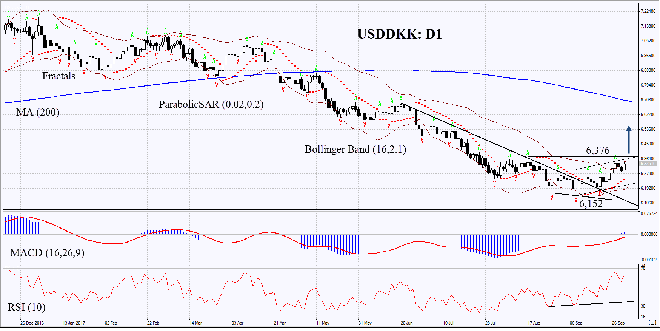
On the daily timeframe, USDDKK: D1 came out of the falling trend into the neutral one. The price correction upwards is possible in case of maintaining the negative rate in Denmark and the publication of negative economic indicators in the eurozone.
- The Parabolic indicator gives a bullish signal.
- The Bollinger bands are narrowing, which means lower volatility.
- The RSI indicator is above 50. It has formed a positive divergence.
- The MACD indicator gives a bullish signal.
The bullish momentum may develop in case USDDKK exceeds the last fractal high and the upper Bollinger band, as well as the upper boundary of the rising channel at 6.376. This level may serve as an entry point. The initial stop loss may be placed below the 3.5-year low, the lower Bollinger band and Parabolic signal at 6.152. After opening the pending order, we shall move the stop to the next fractal low following the Bollinger and Parabolic signals. Thus, we are changing the potential profit/loss to the breakeven point. More risk-averse traders may switch to the 4-hour chart after the trade and place there a stop loss moving it in the direction of the trade. If the price meets the stop level at 6.152 without reaching the order at 6.376 we recommend cancelling the position: the market sustains internal changes that were not taken into account.
Summary of technical analysis
| Position | Buy |
| Buy stop | above 6,376 |
| Stop loss | below 6,152 |
Explore our
Trading Conditions
- Spreads from 0.0 pip
- 30,000+ Trading Instruments
- Stop Out Level - Only 10%
Ready to Trade?
Open Account Note:
This overview has an informative and tutorial character and is published for free. All the data, included in the overview, are received from public sources, recognized as more or less reliable. Moreover, there is no guarantee that the indicated information is full and precise. Overviews are not updated. The whole information in each overview, including opinion, indicators, charts and anything else, is provided only for familiarization purposes and is not financial advice or а recommendation. The whole text and its any part, as well as the charts cannot be considered as an offer to make a deal with any asset. IFC Markets and its employees under any circumstances are not liable for any action taken by someone else during or after reading the overview.
