- Analytics
- Technical Analysis
US Dollar Index Technical Analysis - US Dollar Index Trading: 2017-06-12
Investors expect the Fed rate hike
The result of the former FBI director James Comey’s testimony was the preliminary opinion of American lawyers that the US President Donald Trump had not violated the legislation during his dismissal. This reduced the probability of Trump’s impeachment and had a positive impact on the US dollar. Will the US dollar index continue to grow?
The day before the Senate hearings on the violations during the last election of the US President, the dollar index updated the 7 – month low. The opponents of Donald Trump accused him of violations and threatened with impeachment. After the statement of the former FBI director, political risks decreased and the expectations of investors, the Fed rate cut at the next meeting on June 14, 2017, came to the fore. According to interest rate futures prices, the probability of such an event is estimated by the market almost in 90%. An additional positive factor for the US dollar index was the weakening of the British pound after the results of the parliamentary elections in the UK. The Conservative Party, led by the current Prime Minister Theresa May, lost the majority in the House of Commons. Investors consider this as a political crisis in the country. Now negotiations on the conditions for Britain's exit from the European Union may become significantly complicated.
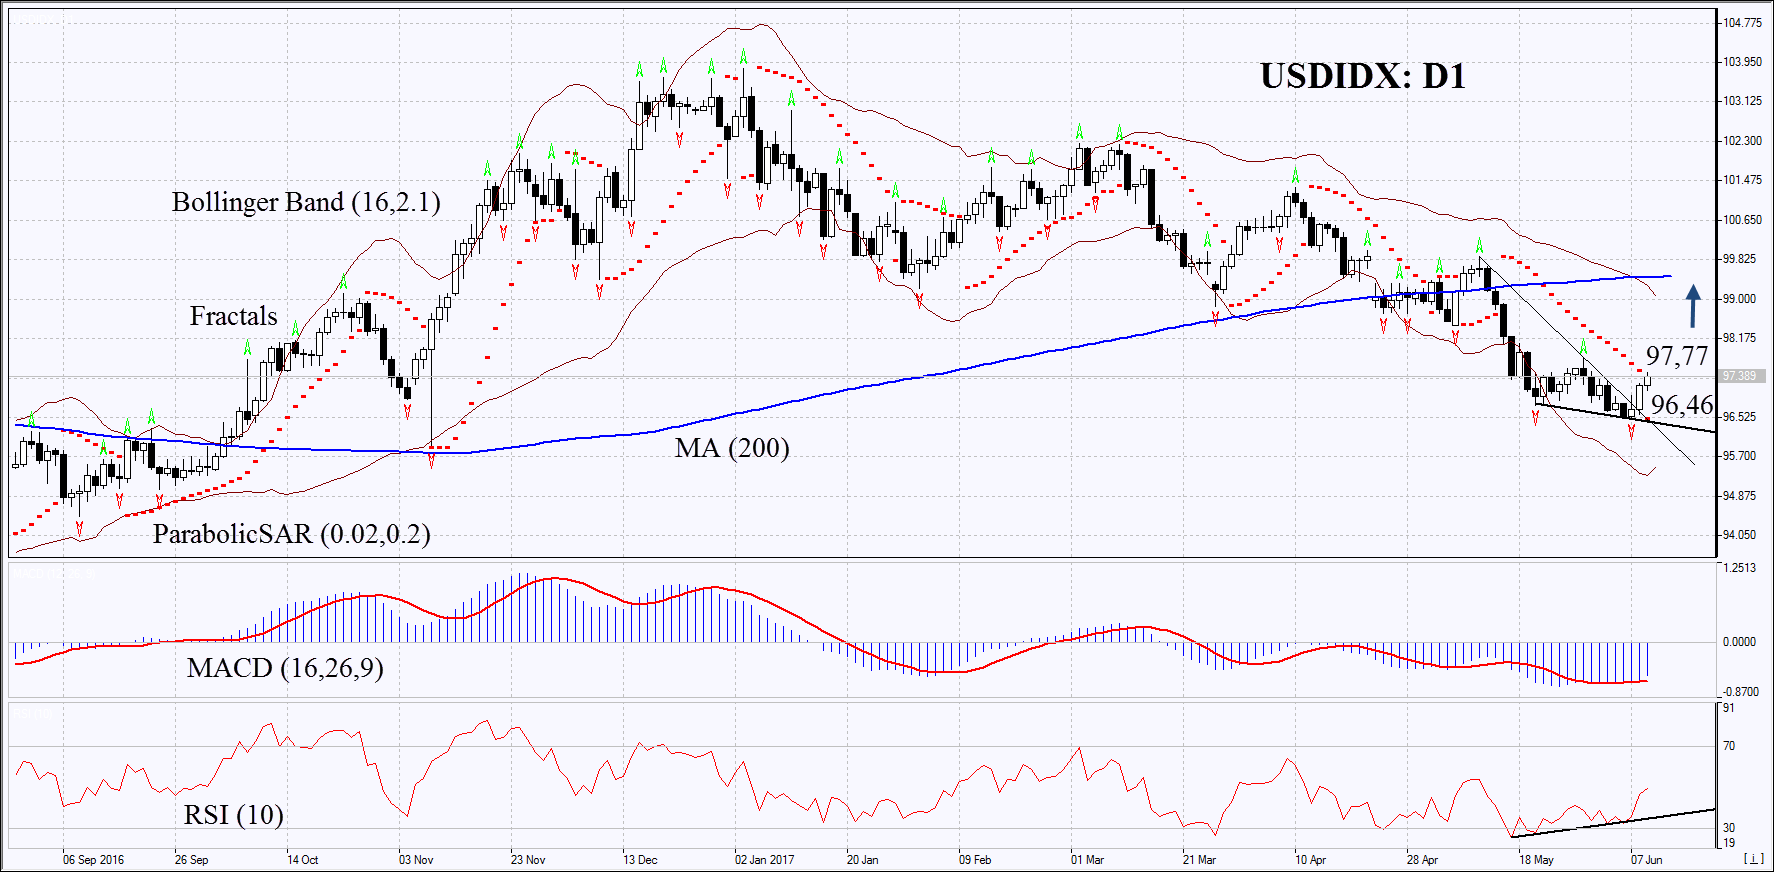
On the daily timeframe, USDIDX: D1 is trying to leave the downtrend to move upwards. The further price growth is possible in case of the Fed rate cut and an increase in political risks in Europe and other countries.
- The Parabolic indicator gives a bullish signal.
- The Bollinger bands have widened, which indicates high volatility. They are titled upward.
- The RSI indicator is near 50. It has formed a positive divergence.
- The MACD indicator gives a bullish signal.
The bullish momentum may develop in case USDIDX exceeds the last fractal high at 97.77. This level may serve as an entry point. The initial stop-loss may be placed below the last fractal low and the Parabolic signal at 96.46. After opening the pending order, we shall move the stop to the next fractal low following the Bollinger and Parabolic signals. Thus, we are changing the potential profit/loss to the breakeven point. More risk-averse traders may switch to the 4-hour chart after the trade and place there a stop-loss moving it in the direction of the trade. If the price meets the stop level 96.46 without reaching the order at 97.77, we recommend cancelling the position: the market sustains internal changes that were not taken into account.
Summary of technical analysis
| Position | Buy |
| Buy stop | Above 97,77 |
| Stop loss | Below 96,46 |
Explore our
Trading Conditions
- Spreads from 0.0 pip
- 30,000+ Trading Instruments
- Stop Out Level - Only 10%
Ready to Trade?
Open Account Note:
This overview has an informative and tutorial character and is published for free. All the data, included in the overview, are received from public sources, recognized as more or less reliable. Moreover, there is no guarantee that the indicated information is full and precise. Overviews are not updated. The whole information in each overview, including opinion, indicators, charts and anything else, is provided only for familiarization purposes and is not financial advice or а recommendation. The whole text and its any part, as well as the charts cannot be considered as an offer to make a deal with any asset. IFC Markets and its employees under any circumstances are not liable for any action taken by someone else during or after reading the overview.
