- Analytics
- Technical Analysis
Wheat Ruble Technical Analysis - Wheat Ruble Trading: 2017-09-26
Drought in Australia may affect wheat prices
In this review, we suggest considering the personal composite instrument (PCI) "Wheat vs. the Russian ruble". It increases in case of the wheat price growth in the world market and the weakening of the Russian currency. Is there a possibility for the WHEAT/RUB prices to increase?
Wheat prices are growing amid weather deterioration in South America and drought in Australia. The Australian government expects that the crop could be minimal for the past 8 years in 2017/18 season and amount to 21.64 mln tonnes. This is much less than the record wheat crop of 35.13 mln tonnes in Australia last year. At the same time, there is an increased world demand for the Russian grain. According to the Ministry of Agriculture of the Russian Federation, Russia exported 8.03 mln tonnes of wheat from July 1 to September 20, 2017, which is by 21.9% more than in the same period of the last 2016/17 season. The Russian ruble may weaken in case of the decline in the Bank of Russia's key rate at its nextmeeting on October 27, 2017. It is 8.5% and markedly exceeds the inflation, which is currently 3.3%.
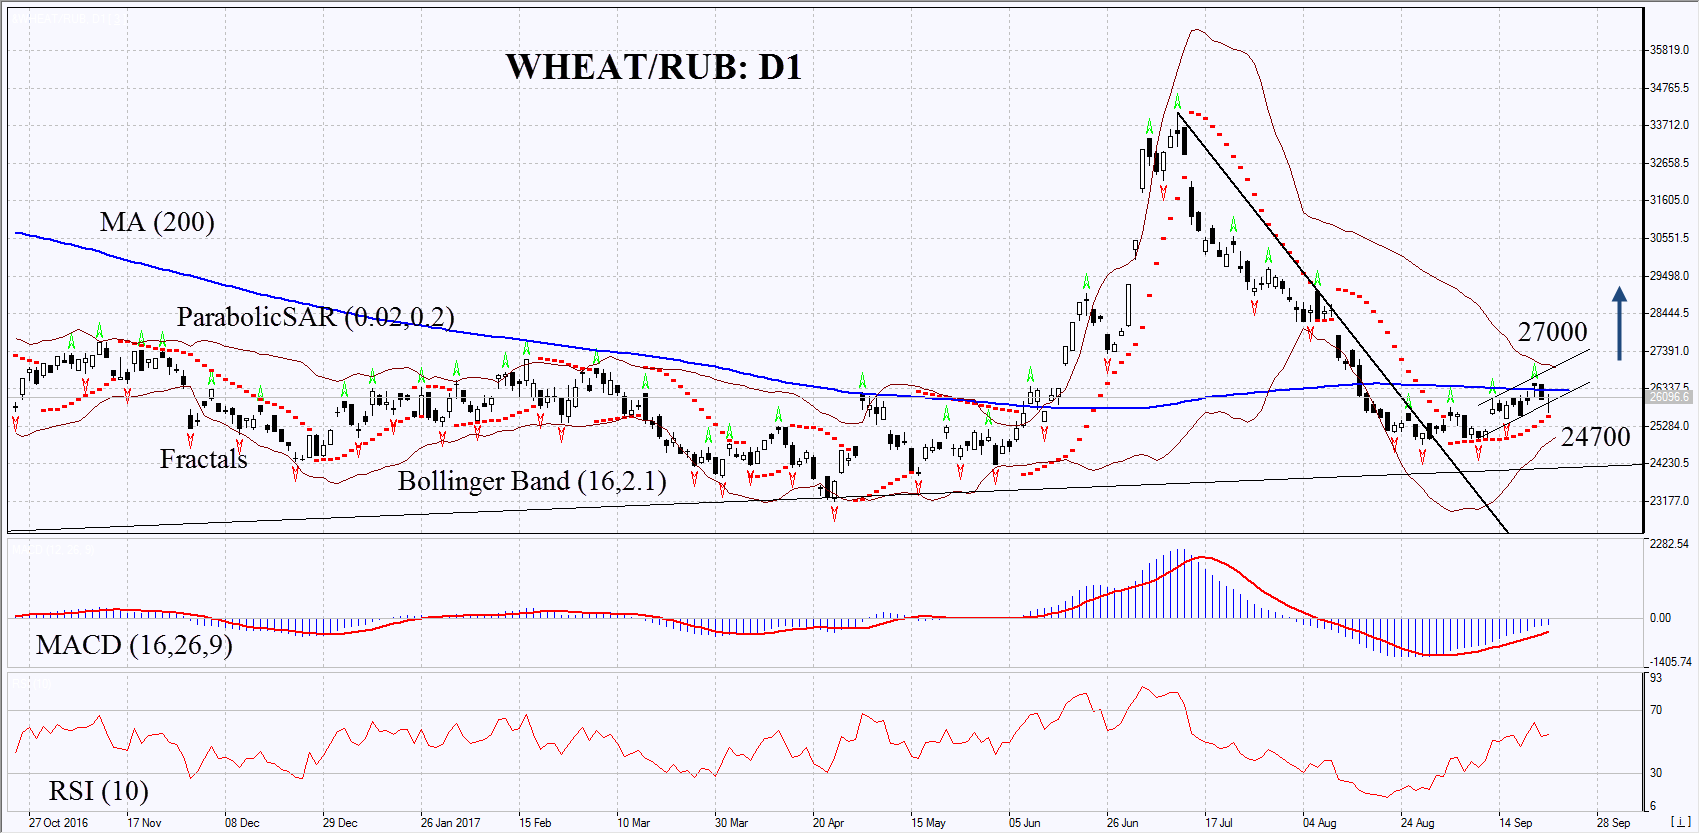
On the daily timeframe, WHEAT/RUB: D1 came out of the downtrend and is trying to exceed the 200-day moving average line. The further price increase is possible in case of the decline in the Bank of Russia’s rate and the reduction of the world wheat crop.
- The Parabolic indicator gives a bullish signal.
- The Bollinger bands have narrowed, which means lower volatility.
- The RSI indicator came out of the oversold zone and started to rise. No divergence.
- The MACD indicator gives a bullish signal.
The bullish momentum may develop in case WHEAT/RUB exceeds the upper Bollinger band at 27000. This level may serve as an entry point. The initial stop loss may be placed below the three last fractal lows, the local low and the Parabolic signal at 24700. After opening the pending order, we shall move the stop to the next fractal low following the Bollinger and Parabolic signals. Thus, we are changing the potential profit/loss to the breakeven point. More risk-averse traders may switch to the 4-hour chart after the trade and place there a stop loss moving it in the direction of the trade. If the price meets the stop level at 24700 without reaching the order at 27000 we recommend cancelling the position: the market sustains internal changes that were not taken into account.
Summary of technical analysis
| Position | Buy |
| Buy stop | above 27000 |
| Stop loss | below 24700 |
Explore our
Trading Conditions
- Spreads from 0.0 pip
- 30,000+ Trading Instruments
- Stop Out Level - Only 10%
Ready to Trade?
Open Account Note:
This overview has an informative and tutorial character and is published for free. All the data, included in the overview, are received from public sources, recognized as more or less reliable. Moreover, there is no guarantee that the indicated information is full and precise. Overviews are not updated. The whole information in each overview, including opinion, indicators, charts and anything else, is provided only for familiarization purposes and is not financial advice or а recommendation. The whole text and its any part, as well as the charts cannot be considered as an offer to make a deal with any asset. IFC Markets and its employees under any circumstances are not liable for any action taken by someone else during or after reading the overview.
