- Analytics
- Technical Analysis
Wheat Ruble Technical Analysis - Wheat Ruble Trading: 2019-07-30
The expected decline in world exports and wheat harvest
In this review, we suggest to consider the WHEAT / RUB Personal Composite Instrument (PCI). It reflects the price dynamics of wheat versus Russian ruble. Is the WHEAT/RUB quotation growth possible?
It rises with the rise in price of wheat on the world market and the weakening of the Russian currency against the US dollar. The Russian agency SovEcon lowered the forecast for wheat exports from Russia in the agricultural season 2019/20 by 6.2 million tons to 31.4 million tons. Note that, according to the European Commission, the export of soft wheat from the EU countries for the first 4 weeks of the 2019/20 season, which began on July 1, was 22% less than last year’s level for the same period and amounted to 762 thousand tons. An additional factor in the growth of wheat prices may be drought and hot weather in the Midwest, which can damage crops. In addition, the heat is observed in Australia and individual EU countries. Against this background, the International Grains Council (IGC) lowered its forecast for world wheat production in the current season by 6 million tons to 763 million tons. The wheat harvest forecast in Russia was reduced to 75.7 million tons from 79.5 million tons. The weakening of the Russian ruble is possible due to the policy of the Central Bank of the Russian Federation aimed at further reducing the rate. In 2019, it was already reduced twice by 0.25% from 7.75% to 7.25%. This is a minimum since March 2014, when Western sanctions were not yet imposed on Russia. The Central Bank of the Russian Federation intends to further reduce the rate and bring it closer to inflation, which in Russia now stands at 4.7% in annual terms.
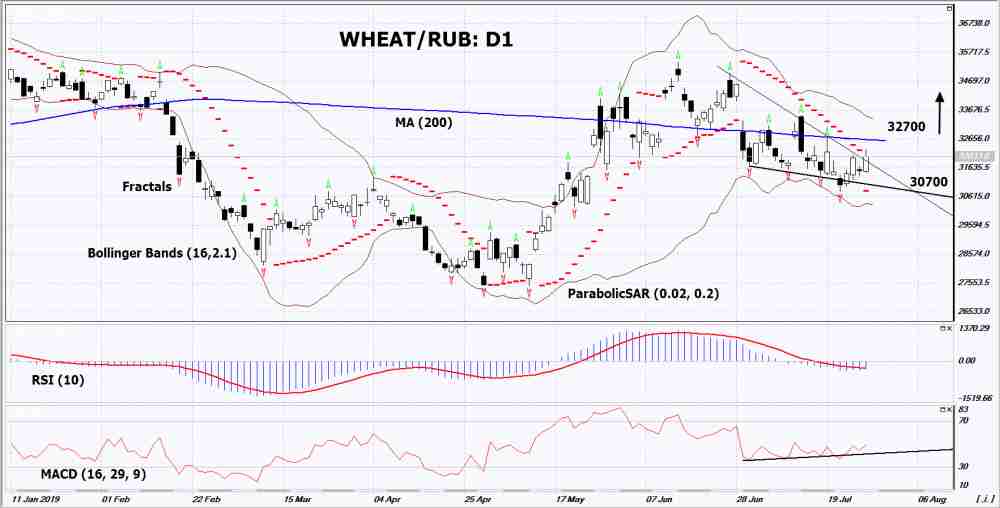
On the daily timeframe WHEAT/RUB: D1 exceeded the resistance line of the downward trend. Various technical analysis indicators have generated uptrend signals. Further growth of quotations is possible in case of an increase in demand and a reduction in world yield.
- The Parabolic indicator shows a signal to increase.
- The Bolinger bands widened, indicating high volatility. The bottom line of Bollinger has a slope up.
- The RSI indicator is below 50. It formed a weak divergence to the increase.
- The MACD indicator gives a bullish signal.
The bullish momentum may develop if WHEAT/RUB exceeds the last upper fractal and the 200-day moving average line: 32700. This level can be used as an entry point. The initial stop lose may be placed lower than the last lower fractal and the Parabolic signal: 30700. After opening the pending order stop shall be moved following the signals of Bollinger and Parabolic to the next fractal minimum. Thus, we are changing the potential profit/loss to the breakeven point. More risk-averse traders may switch to the 4-hour chart after the trade and place a stop loss moving it in the direction of the trade. If the price meets the stop level (30700) without reaching the order (32700), we recommend to cancel the order: the market sustains internal changes that were not taken into account.
Technical Analysis Summary
| Position | Buy |
| Buy stop | Above 32700 |
| Stop loss | Below 30700 |
Explore our
Trading Conditions
- Spreads from 0.0 pip
- 30,000+ Trading Instruments
- Stop Out Level - Only 10%
Ready to Trade?
Open Account Note:
This overview has an informative and tutorial character and is published for free. All the data, included in the overview, are received from public sources, recognized as more or less reliable. Moreover, there is no guarantee that the indicated information is full and precise. Overviews are not updated. The whole information in each overview, including opinion, indicators, charts and anything else, is provided only for familiarization purposes and is not financial advice or а recommendation. The whole text and its any part, as well as the charts cannot be considered as an offer to make a deal with any asset. IFC Markets and its employees under any circumstances are not liable for any action taken by someone else during or after reading the overview.
