- Analytics
- Technical Analysis
Silver/US Dollar Technical Analysis - Silver/US Dollar Trading: 2017-06-05
India may increase purchases of silver
According to the GFMS forecast, silver imports to India may increase by 40% this year compared to 2016. Will the silver prices grow?
Last year, silver imports to India declined by 65% to 2,793 tonnes. At the same time, its value increased by 13%. 55% of imported silver is used in the Indian jewelry industry and 42% for investment purposes. In the Q1, 2017, foreign silver shipments to the country were the highest in the last 5 quarters. An additional factor for the possible growth of silver prices may be the global deficit of spot silver for 4 consecutive years: 2013-2016. The demand for silver in China's solar energy increased twice last year and reached 12.1 mln. ounces. At the same time, the world production of silver decreased by 0.6% last year for the first time in 14 years.
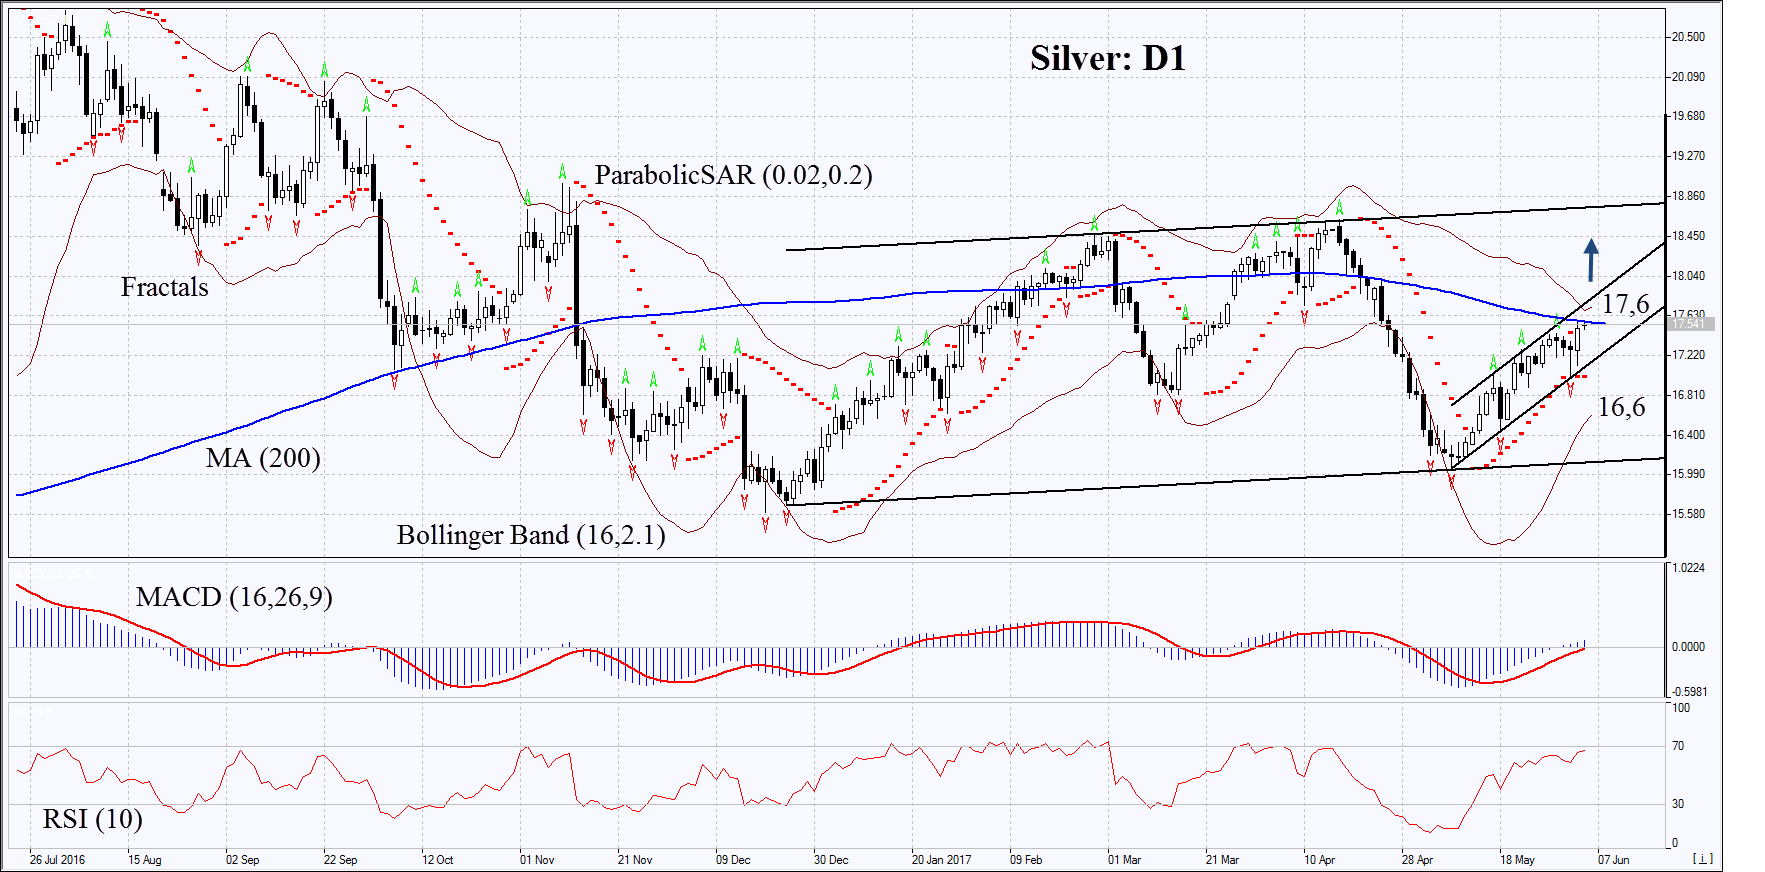
On the daily timeframe, XAGUSD: D1 is in a rising trend. The further price increase is possible in case of a reduction in production and an increase in global demand, including the alternative energy.
- The Parabolic indicator gives a bullish signal.
- The Bollinger bands have narrowed, which means low volatility. They are tilted upwards.
- The RSI indicator is above 50. No divergence.
- The MACD indicator gives a bullish signal.
The bullish momentum may develop in case Silver exceeds the 200-day moving average line and the last fractal high at 17.6. This level may serve as an entry point. The initial stop loss may be placed below the last fractal low, the Parabolic signal and the lower Bollinger band at 16.6. After opening the pending order, we shall move the stop to the next fractal low following the Bollinger and Parabolic signals. Thus, we are changing the potential profit/loss to the breakeven point. More risk-averse traders may switch to the 4-hour chart after the trade and place there a stop loss moving it in the direction of the trade. If the price meets the stop level at 16.6 without reaching the order at 17.6 we recommend cancelling the position: the market sustains internal changes that were not taken into account.
Technical Analysis Summary
| Position | Buy |
| Buy stop | Above 17,6 |
| Stop loss | Below 16,6 |
Explore our
Trading Conditions
- Spreads from 0.0 pip
- 30,000+ Trading Instruments
- Stop Out Level - Only 10%
Ready to Trade?
Open Account Note:
This overview has an informative and tutorial character and is published for free. All the data, included in the overview, are received from public sources, recognized as more or less reliable. Moreover, there is no guarantee that the indicated information is full and precise. Overviews are not updated. The whole information in each overview, including opinion, indicators, charts and anything else, is provided only for familiarization purposes and is not financial advice or а recommendation. The whole text and its any part, as well as the charts cannot be considered as an offer to make a deal with any asset. IFC Markets and its employees under any circumstances are not liable for any action taken by someone else during or after reading the overview.
