- Analytics
- Technical Analysis
Palladium Technical Analysis - Palladium Trading: 2019-07-16
Car sales are declining worldwide
Palladium quotations again approached the historical maximum. Meanwhile, the car sales worldwide is decreasing. Is XPDUSD correction possible?
Approximately 80% of global palladium consumption is accounted for by the automotive industry and the production of catalysts to reduce harmful gasoline engine emissions. Another 5% is consumed by the global chemical industry. As environmental standards tightened, the demand for autocatalysts increased and the price of palladium soared 3 times in the last 3 years. Now it has reached the psychological level of $ 1600 / ounce for the 2nd time. Meanwhile, according to the estimates of the Association of European Businesses, the Association of European Automobile Manufacturers and a number of consulting agencies, sales of automobiles in the world decreased by 7.4% in 1Q2019 compared to the same period of 2018. The data for the first half of the year may turn out to be even worse, since according to official data, the decline in car sales in China in January-May 2019 was 15.2%. Note that after 3-fold growth of palladium quotations, its consumption has decreased in the jewelry and electronics industry, in dental prosthetic and in the issue of investment coins and bars. Theoretically, it is possible to increase the dependence of quotations on the state of affairs in the global automotive industry and the chemical industry.
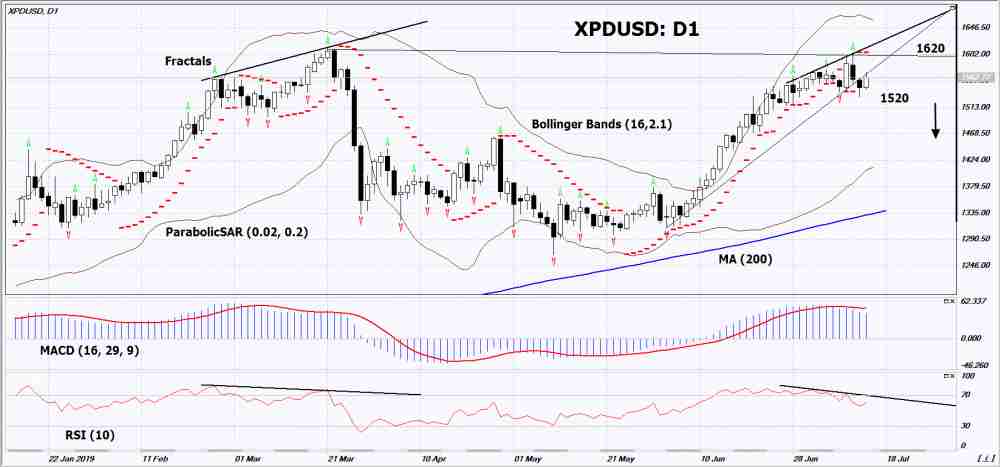
On the daily timeframe XPDUSD: D1 adjusted down from the historical maximum. It overcame the growing trend support line. Decrease in quotations is possible in the event of a decrease in global demand and a continuation of the decline in the Chinese automotive industry.
- The Parabolic indicator indicates signal to decrease.
- The Bolinger bands widened, indicating high volatility. The top line slopes down.
- The RSI indicator is above the 50 mark. It has formed a divergence to decrease.
- The MACD indicator gives bearish signal.
The bearish momentum may develop if XPDUSD will drop below its last high: 1520. This level can be used as an entry point. The initial stop lose may be placed higher than the last upper fractal, the historical maximum and the Parabolic signal: 1620. After opening the pending order, stop shall be moved following the the Bollinger and Parabolic signals to the next fractal minimum. Thus, we are changing the potential profit/loss to the breakeven point. More risk-averse traders may switch to the 4-hour chart after the trade and place a stop loss moving it in the direction of the trade. If the price meets the stop level (1520) without reaching the order (1620), we recommend to cancel the order: the market sustains internal changes that were not taken into account.
Technical Analysis Summary
| Position | Sell |
| Sell stop | Below 1520 |
| Stop loss | Above 1620 |
Explore our
Trading Conditions
- Spreads from 0.0 pip
- 30,000+ Trading Instruments
- Stop Out Level - Only 10%
Ready to Trade?
Open Account Note:
This overview has an informative and tutorial character and is published for free. All the data, included in the overview, are received from public sources, recognized as more or less reliable. Moreover, there is no guarantee that the indicated information is full and precise. Overviews are not updated. The whole information in each overview, including opinion, indicators, charts and anything else, is provided only for familiarization purposes and is not financial advice or а recommendation. The whole text and its any part, as well as the charts cannot be considered as an offer to make a deal with any asset. IFC Markets and its employees under any circumstances are not liable for any action taken by someone else during or after reading the overview.
