- Analytics
- Technical Analysis
Australian Stock Index Technical Analysis - Australian Stock Index Trading: 2017-11-10
Rising trade surplus bullish for Australian stock index
Australia’s trade surplus rose in September. Will the AU200 stock index continue rising?
Latest data from China, Australia’s biggest export market, were positive: inflation rose to 1.9% in October from 1.6% in September. This points to healthy economy growth and growing demand in China, a positive development for global growth prospect. And latest data reflect the positive impact China’s growth is having on Australian economy: Australia’s trade balance surplus rose to 1.745 billion Australian dollars in September from 0.873 billion in the previous month. And the Reserve Bank of Australia (RBA) held the interest rate at 1.5% at its November 7 policy meeting. Accommodative RBA monetary policy and robust Chinese economy are bullish for Australia’s stock market index.
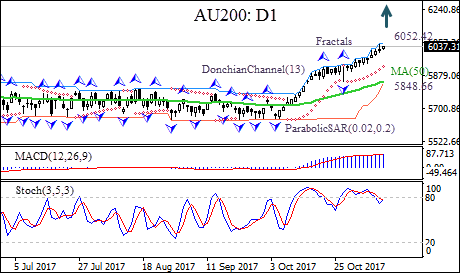
On the daily timeframe AU200: D1 is rallying after hitting four-month low in the beginning of June. The price is above the 50-day moving average MA(50) and has breached out from the range it has been trading since the start of 2017.
- The Donchian channel indicates an uptrend: it is tilted upward.
- The Parabolic indicator has formed a buy signal.
- The MACD indicator is above the signal line and the gap is widening, which is a bullish signal.
- The stochastic oscillator is rising but hasn't breached into overbought zone.
We believe the bullish momentum will continue after the price closes above the upper boundary of Donchian channel at 6052.42. This level can be used as an entry point for placing a pending order to buy. The stop loss can be placed below the fractal low at 5848.66. After placing the order, the stop loss is to be moved every day to the next fractal low, following Parabolic signals. Thus, we are changing the probable profit/loss ratio to the breakeven point. If the price meets the stop loss level (5848.66) without reaching the order (6052.42), we recommend cancelling the position: the market has undergone internal changes which were not taken into account.
Technical Analysis Summary
| Position | Buy |
| Buy stop | Above 6052.42 |
| Stop loss | Below 5848.66 |
- Get Certificate

Note:
This overview has an informative and tutorial character and is published for free. All the data, included in the overview, are received from public sources, recognized as more or less reliable. Moreover, there is no guarantee that the indicated information is full and precise. Overviews are not updated. The whole information in each overview, including opinion, indicators, charts and anything else, is provided only for familiarization purposes and is not financial advice or а recommendation. The whole text and its any part, as well as the charts cannot be considered as an offer to make a deal with any asset. IFC Markets and its employees under any circumstances are not liable for any action taken by someone else during or after reading the overview.
