- Analytics
- Technical Analysis
GB 100 Index Technical Analysis - GB 100 Index Trading: 2018-10-29
Quarterly earnings reports may affect the dynamics of the index
The British stock index has fallen by almost 10% since the beginning of October and it looks oversold. Is there a possibility for GB100 prices to correct up?
A positive factor for the UK stock market may become the decrease in inflation in September of the current year to 2.4% year over year, compared with 2.7% in August. Due to this, it is expected that the Bank of England will give up the further rate hike and will keep it at the current level of 0.75% at its next meeting on November 1. Let us recall that the rate hike policy started in September 2017 from a historic low of 0.25%. The earnings reports of HSBC, which will be released on October 29, can affect the dynamics of the FTSE 100. It is possible that the reports will be positive, as another British bank Lloyds Bank published good quarterly results earlier.
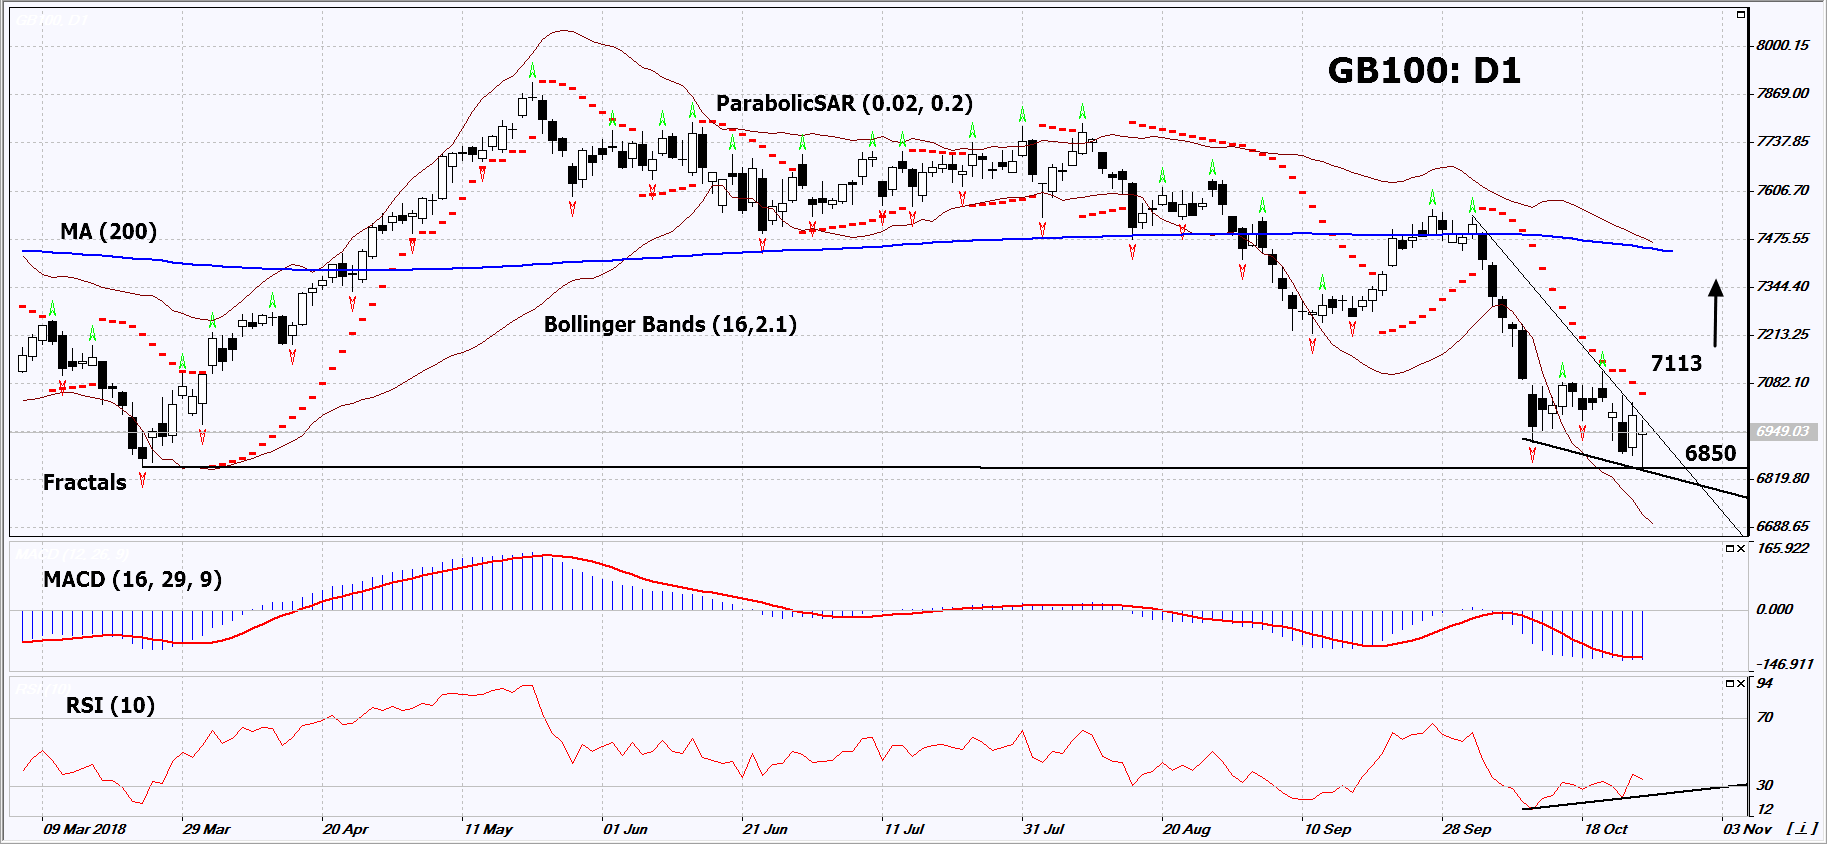
On the daily timeframe, GB100: D1 is trying to move upward from the triangle. A number of technical analysis indicators formed buy signals. The further price increase is possible in case of positive corporate reports and successful negotiations on Brexit.
- The Parabolic indicator gives a bearish signal. It can be used as an additional resistance level, which must be overcome before opening a buy position.
- The Bollinger bands have widened a lot, which indicates high volatility. They are titled downward.
- The RSI indicator is below 50. It has formed a positive divergence.
- The MACD indicator gives a bullish signal.
The bullish momentum may develop in case GB100 exceeds its last fractal high and the Parabolic signal at 7113. This level may serve as an entry point. The initial stop loss may be placed below the last low at 6850. After opening the pending order, we shall move the stop to the next fractal low following the Bollinger and Parabolic signals. Thus, we are changing the potential profit/loss to the breakeven point. More risk-averse traders may switch to the 4-hour chart after the trade and place there a stop loss moving it in the direction of the trade. If the price meets the stop level (6850) without reaching the order (7113), we recommend to close the position: the market sustains internal changes that were not taken into account.
Summary of technical analysis
| Position | Buy |
| Buy stop | Above 7113 |
| Stop loss | Below 6850 |
- Get Certificate

Note:
This overview has an informative and tutorial character and is published for free. All the data, included in the overview, are received from public sources, recognized as more or less reliable. Moreover, there is no guarantee that the indicated information is full and precise. Overviews are not updated. The whole information in each overview, including opinion, indicators, charts and anything else, is provided only for familiarization purposes and is not financial advice or а recommendation. The whole text and its any part, as well as the charts cannot be considered as an offer to make a deal with any asset. IFC Markets and its employees under any circumstances are not liable for any action taken by someone else during or after reading the overview.
