- Analytics
- Technical Analysis
Hang Seng Index Technical Analysis - Hang Seng Index Trading: 2019-11-22
Weak data bearish for HK50
Hong Kong’s private sector contraction continued in October. Will the HK50 decline?
Hong Kong economic data were weak since its central bank mirrored Fed’s rate cut on October 31: retail sales’ 20.4% decline over year in September was the eighth straight month of drop. And the October reading of purchasing managers index was below 50 again, indicating acceleration of contraction in the private sector. Activities in private sector contracted for the nineteenth straight month as new orders dropped due to a record fall in new business from mainland China, pointing to weakness ahead too. The slump in activities is being attributed to US-China trade tensions, as well as protest related disruptions. And unemployment rose to 3.1% in the three months to October from 2.9% in the prior period. Continuing decline in activities in private business sector is bearish for HK50.
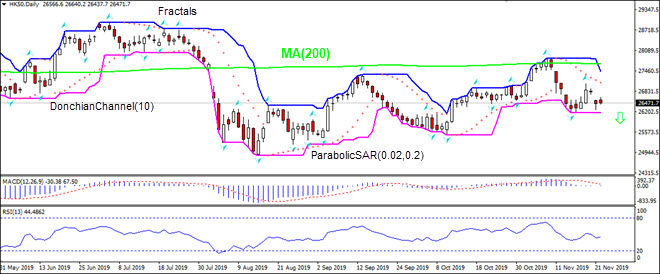
On the daily timeframe HK50: D1 is retracing lower after a rebound following the decline to 11-month low in the beginning of August.
- The Parabolic indicator gives a sell signal.
- The Donchian channel indicates downtrend: it is narrowing down.
- The MACD indicator has fallen below the signal line. This is a bearish signal.
- The RSI oscillator is falling below 50 level.
We believe the bearish momentum will continue after the price breaches below the lower Donchian boundary at 26154. This level can be used as an entry point for placing a pending order to sell. The stop loss can be placed above the upper Donchian boundary at 27441.50. After placing the pending order the stop loss is to be moved every day to the next fractal high, following Parabolic signals. Thus, we are changing the expected profit/loss ratio to the breakeven point. If the price meets the stop-loss level (27441.50) without reaching the order (26154) we recommend cancelling the order: the market sustains internal changes which were not taken into account.
Technical Analysis Summary
| Order | Sell |
| Sell Stop | Below 26154 |
| Stop loss | Above 27441.50 |
- Get Certificate

Note:
This overview has an informative and tutorial character and is published for free. All the data, included in the overview, are received from public sources, recognized as more or less reliable. Moreover, there is no guarantee that the indicated information is full and precise. Overviews are not updated. The whole information in each overview, including opinion, indicators, charts and anything else, is provided only for familiarization purposes and is not financial advice or а recommendation. The whole text and its any part, as well as the charts cannot be considered as an offer to make a deal with any asset. IFC Markets and its employees under any circumstances are not liable for any action taken by someone else during or after reading the overview.
