- Analytics
- Technical Analysis
OATS Technical Analysis - OATS Trading: 2018-10-30
Cereal crop harvesting in the US ends
Cereal crop harvesting in the US ends. Will oat prices fall?
The US Department of Agriculture reported that by October 28, 64% of corn and 70% of soybean had been harvested. On average, the harvest is good. At the same time, the demand for oats may slightly decrease amid an excess of soybean. China has increased the import duties on US soybeans and practically stopped its purchases. Soybeans and oats are used in the production of combined feed for livestock and poultry.
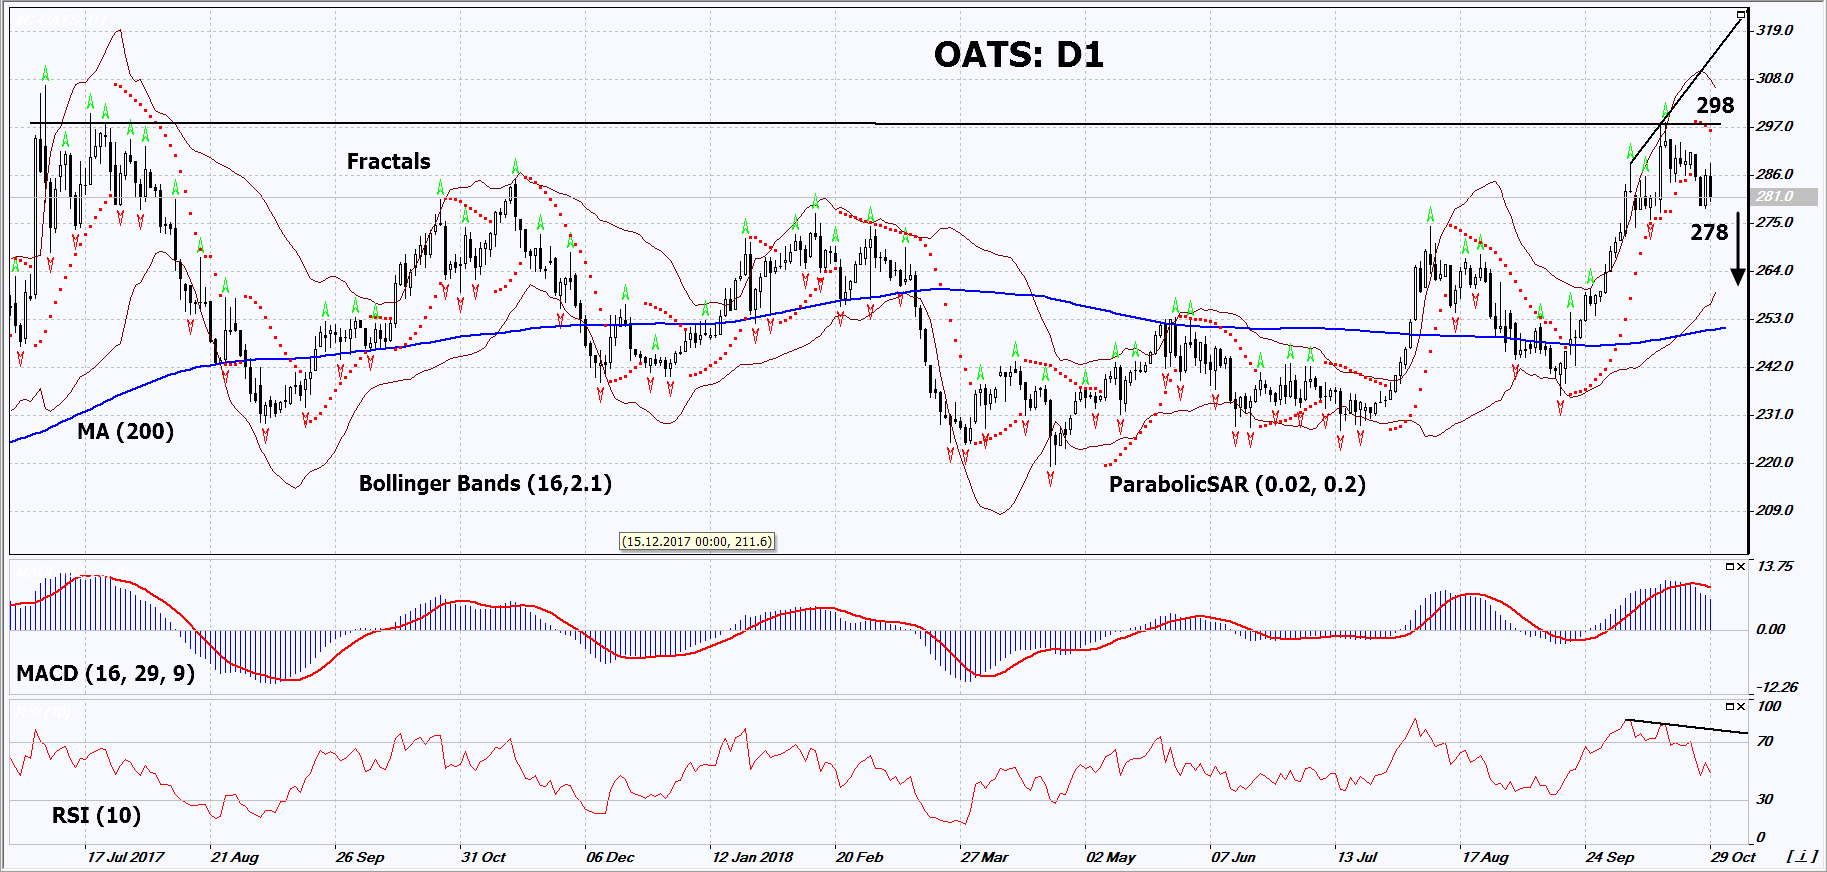
On the daily timeframe, OATS: D1 D1 is correcting down from a 15-month high. Good weather in the USA and a decline in demand can contribute to the further price decrease.
- The Parabolic indicator gives a bearish signal.
- The Bollinger bands have widened, which indicates high volatility. The upper band is titled down.
- The RSI indicator is below 50. It has formed a negative divergence.
- The MACD indicator gives bearish signals.
The bearish momentum may develop in case OATS falls below its last low at 278. This level may serve as an entry point. The initial stop loss may be placed above the last fractal high, the 15-month high and the Parabolic signal at 298. After opening the pending order, we shall move the stop to the next fractal high following the Bollinger and Parabolic signals. Thus, we are changing the potential profit/loss to the breakeven point. More risk-averse traders may switch to the 4-hour chart after the trade and place there a stop loss moving it in the direction of the trade. If the price meets the stop level (298) without reaching the order (278), we recommend to close the position: the market sustains internal changes that were not taken into account.
Summary of technical analysis
| Position | Sell |
| Sell stop | Below 278 |
| Stop loss | Above 298 |
- Get Certificate

Note:
This overview has an informative and tutorial character and is published for free. All the data, included in the overview, are received from public sources, recognized as more or less reliable. Moreover, there is no guarantee that the indicated information is full and precise. Overviews are not updated. The whole information in each overview, including opinion, indicators, charts and anything else, is provided only for familiarization purposes and is not financial advice or а recommendation. The whole text and its any part, as well as the charts cannot be considered as an offer to make a deal with any asset. IFC Markets and its employees under any circumstances are not liable for any action taken by someone else during or after reading the overview.
