- Analytics
- Technical Analysis
Soybean Trade Technical Analysis - Soybean Trade Trading: 2018-09-24
The EU increased imports of US soybeans
The European Union increased imports of US soybeans. Will SOYB prices continue rising?
Earlier in August, Jean-Claude Juncker, the European Commission president, promised to increase the volume of US soybean purchases in talks with US President Donald Trump in exchange to the easing of restrictions on imports of European cars to the US. Over the past 12 weeks, the supply of soybeans from the US to the EU increased by 133% to 1.47 million tons based on the data released at the end of the last week. The share of US soybeans in the European market increased to 52% from 25% in the same period of 2017. Thus, US authorities support their farmers. Earlier, China raised duties on US soybeans by 25% in response to the increase in duties on a number of Chinese goods by the US. Because of this, soybean prices have fallen by almost 30% since April of the current year, and on September 18, 2018 reached a 10-year low. Now they are trying to correct upward, as such a noticeable decline has increased the demand of consumers. An additional factor for the increase may be rainy weather in the US, if it hinders the crops and harvesting.
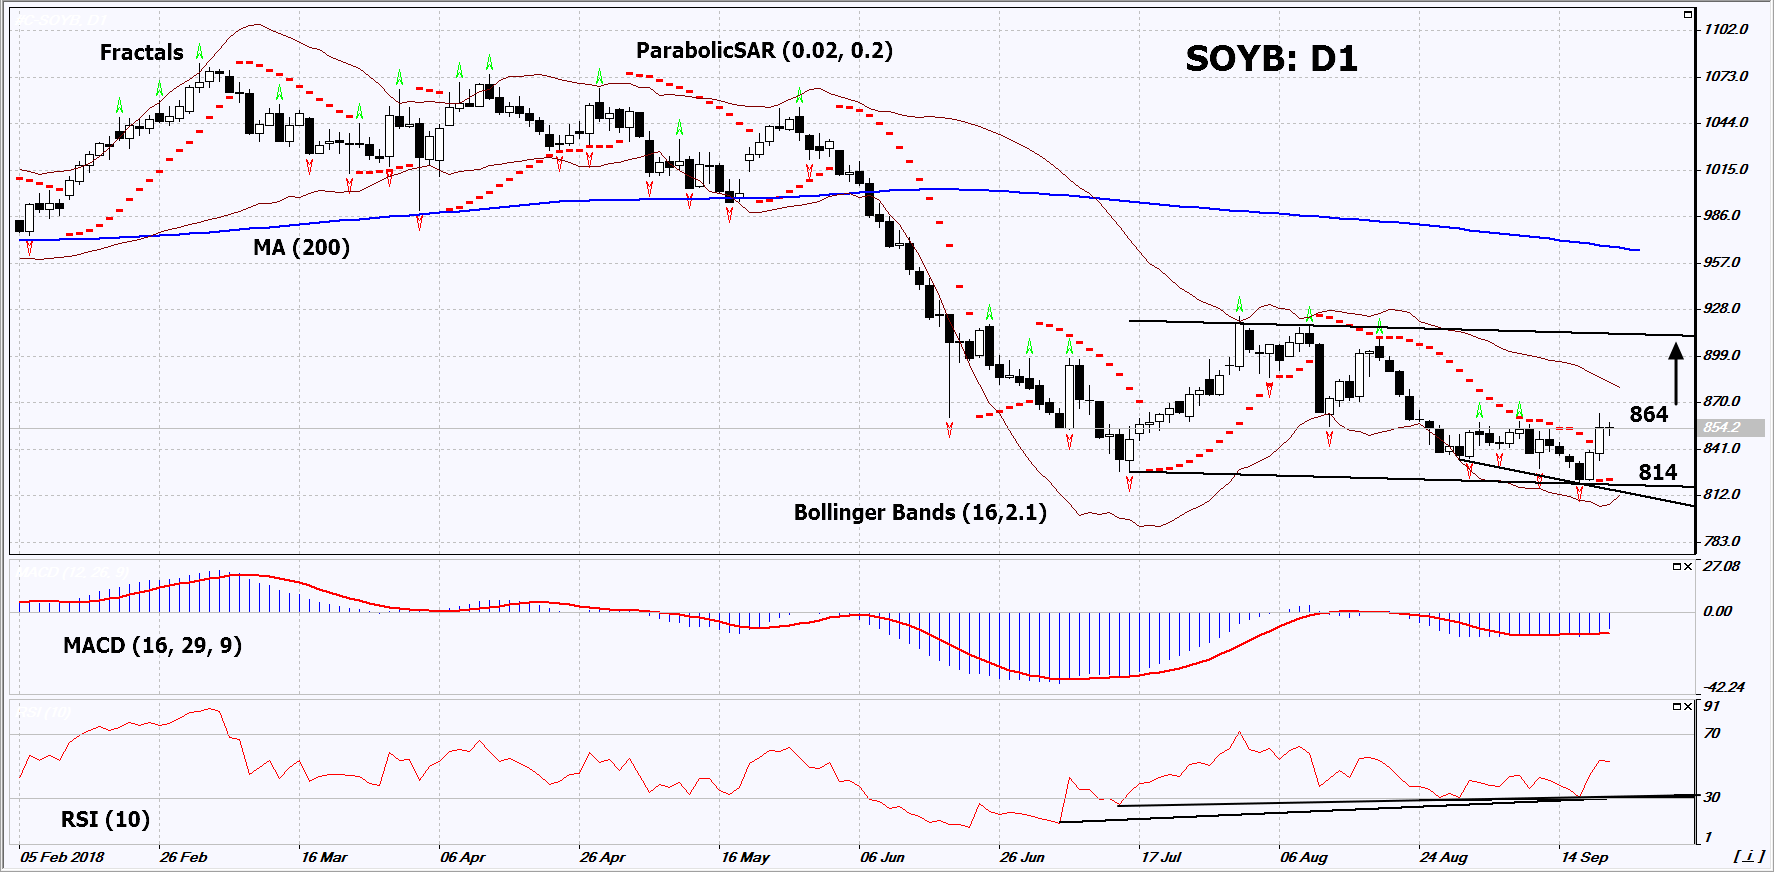
On the daily timeframe, SOYB: D1 has updated the low since December 2008 and is trying to correct upward within the framework of the falling channel. A number of technical analysis indicators formed buy signals. The further price increase is possible in case of an increase in demand from non-Chinese buyers, as well as in case of the worsening of weather conditions in the US.
- The Parabolic indicator gives a bullish signal.
- The Bollinger bands have narrowed, which indicates low volatility. The lower band is titled upward.
- The RSI indicator is above 50. It has formed a positive divergence.
- The MACD indicator gives a bullish signal.
The bullish momentum may develop in case SOYB exceeds its last high at 864. This level may serve as an entry point. The initial stop loss may be placed below the last fractal low, the 10-year low, the lower Bollinger band and the Parabolic signal at 814. After opening the pending order, we shall move the stop to the next fractal low following the Bollinger and Parabolic signals. Thus, we are changing the potential profit/loss to the breakeven point. More risk-averse traders may switch to the 4-hour chart after the trade and place there a stop loss moving it in the direction of the trade. If the price meets the stop level (814) without reaching the order (864), we recommend to close the position: the market sustains internal changes that were not taken into account.
Summary of technical analysis
| Position | Buy |
| Buy stop | Above 864 |
| Stop loss | Below 814 |
- Get Certificate

Note:
This overview has an informative and tutorial character and is published for free. All the data, included in the overview, are received from public sources, recognized as more or less reliable. Moreover, there is no guarantee that the indicated information is full and precise. Overviews are not updated. The whole information in each overview, including opinion, indicators, charts and anything else, is provided only for familiarization purposes and is not financial advice or а recommendation. The whole text and its any part, as well as the charts cannot be considered as an offer to make a deal with any asset. IFC Markets and its employees under any circumstances are not liable for any action taken by someone else during or after reading the overview.
