- Analytics
- Technical Analysis
USD/CHF Technical Analysis - USD/CHF Trading: 2016-09-23
Delay in Fed rate hike lifts Swiss franc
The Swiss National Bank left interest rates unchanged as the Swiss economy accelerated in the second quarter. However the growth is expected to moderate with disinflation persisting. Will the Swiss franc continue rising?
The Swiss National Bank decided to keep the target range for the three-month Libor at between minus 1.25% and minus 0.2 at its 15 September meeting. The central bank also left the interest rate on deposits at minus 0.75%. The Swiss GDP grew 0.6% in second quarter, above 0.4% expansion in the first quarter. Increased government spending and rebounding external trade resulted in growth acceleration. Compared to the same quarter one year ago, GDP rose 2.0%, which was above first quarter’s 1.1% annual growth. However the central bank stated it expects more modest growth in the second half of the year partly due to weakening of growth in Europe. It updated the GDP growth forecast for 2016 to approximately 1.5% from a range of between 1.0% and 1.5% and kept the inflation forecast of minus 0.4%, stating reduced inflationary pressures from slowing global economy. While the central bank projects the recovery will continue, low growth rates and consumer price disinflation forecast are not bullish for the Swiss franc. Safe haven demand is another important factor for Swiss currency rate. And against this background Federal Reserve’s policy course to tighten money supply provides additional support to US dollar against the Swiss franc.
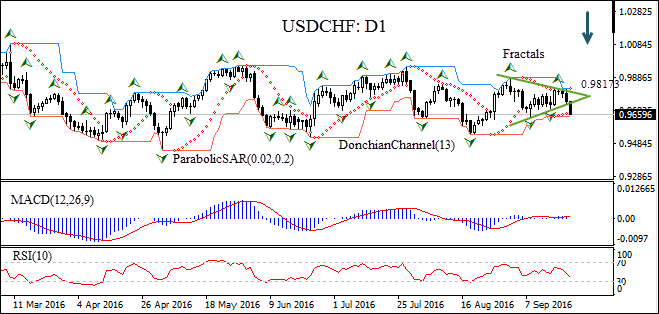
The USDCHF had been consolidating in a symmetrical triangle on the daily chart before breaking below the lower trend line.
- The Parabolic indicator gives a sell signal.
- The Donchian channel signals no trend has formed yet: the channel is flat.
- The MACD indicator is above the signal but the gap is falling, which is a bearish signal.
- The RSI oscillator is falling, but hasn’t reached the oversold zone.
The price has breached below the last fractal low. We can go short straight away. The stop loss can be placed above the fractal high at 0.98173. After placing the order, the stop loss is to be moved every day to the next fractal high, following Parabolic signals. Thus, we are changing the probable profit/loss ratio to the breakeven point. If the price meets the stop loss level without reaching the order, we recommend cancelling the position: the market sustains internal changes which were not taken into account.
Technical Analysis Summary
| Position | Sell |
| Sell limit | Above 0.9649 |
| Stop loss | Above 0.98173 |
- Get Certificate

Note:
This overview has an informative and tutorial character and is published for free. All the data, included in the overview, are received from public sources, recognized as more or less reliable. Moreover, there is no guarantee that the indicated information is full and precise. Overviews are not updated. The whole information in each overview, including opinion, indicators, charts and anything else, is provided only for familiarization purposes and is not financial advice or а recommendation. The whole text and its any part, as well as the charts cannot be considered as an offer to make a deal with any asset. IFC Markets and its employees under any circumstances are not liable for any action taken by someone else during or after reading the overview.
