- Analytics
- Technical Analysis
US Dollar Index Technical Analysis - US Dollar Index Trading: 2018-09-05
Expanding US economic activity bullish for USDIDX
Continued rise in retail sales and expansion in manufacturing sector indicates US economy remains strong. Will the USDIDX continue advancing?
US economic data were positive on balance in the past month: the second quarter GDP was upgraded to 4.2% from 4.1% annual rate of preliminary reading. Retail sales rose 6.4% over year in July, higher than previous month and above expectations. This was the fifth month retail sales rose after a weak start to year. On the other hand durable goods orders fell in July. And personal spending remained at 0.4% over month, while manufacturing activity expansion accelerated in August according to the ISM manufacturing index. Positive economic data indicating accelerating economy are bullish for the dollar index.
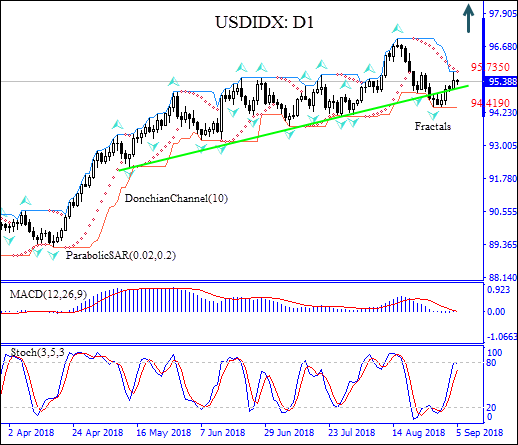
On the daily timeframe the USDIDX: D1 has been rising after hitting 44-month low in mid-February. It has risen above the support line after dipping below it for couple of sessions.
- The Parabolic indicator gives a buy signal.
- The Donchian channel indicates no trend: it is flat.
- The MACD indicator gives a bullish signal: it is below the signal line and the gap is narrowing.
- The Stochastic oscillator is rising but has not breached into the overbought zone yet.
We expect the bullish momentum will endure after the price breaches above the upper Donchian bound at 95.7350. A price below that level can be used as an entry point for a pending order to buy. The stop loss can be placed below the lower Donchian bound at 94.4190. After placing the pending order, the stop loss is to be moved to the next fractal low, following Parabolic signals. By doing so, we are changing the probable profit/loss ratio to the breakeven point. If the price meets the stop loss level (94.4190) without reaching the order, we recommend canceling the order: the market sustains internal changes which were not taken into account.
Technical Analysis Summary
| Position | Buy |
| Buy stop | Above 95.4190 |
| Stop loss | Below 94.4190 |
- Get Certificate

Note:
This overview has an informative and tutorial character and is published for free. All the data, included in the overview, are received from public sources, recognized as more or less reliable. Moreover, there is no guarantee that the indicated information is full and precise. Overviews are not updated. The whole information in each overview, including opinion, indicators, charts and anything else, is provided only for familiarization purposes and is not financial advice or а recommendation. The whole text and its any part, as well as the charts cannot be considered as an offer to make a deal with any asset. IFC Markets and its employees under any circumstances are not liable for any action taken by someone else during or after reading the overview.
