- Analytics
- Technical Analysis
Gold Ruble Technical Analysis - Gold Ruble Trading: 2017-11-01
The Rate Decrease of the Russian Central Bank May Weaken the Ruble
In this review, we suggest considering the personal composite instrument (PCI) Gold against the Russian ruble. It reflects the dynamics of gold prices expressed in Russian rubles. The PCI increases in case of the weakening of the Russian currency and the increase in gold prices in the world market.
The main factor of the possible weakening of the ruble is the further key rate decrease of the Russian CB. Currently it is 8.25%. This is much higher than the current inflation level in Russia. As of October 16, it was only 2.7% in annual terms. The growth of world gold prices may be contributed by the US political crisis on the background of the investigation of Paul Manafort, the US President Donald Trump’s campaign chairman. In addition, the new head of the Fed may become one of its directors - Jerome Powell. He is known for his easy monetary policy with respect of further rate increases. The suspension of the Fed rate hike policy may have a negative impact on the US dollar rate and contribute to the growth of gold prices.
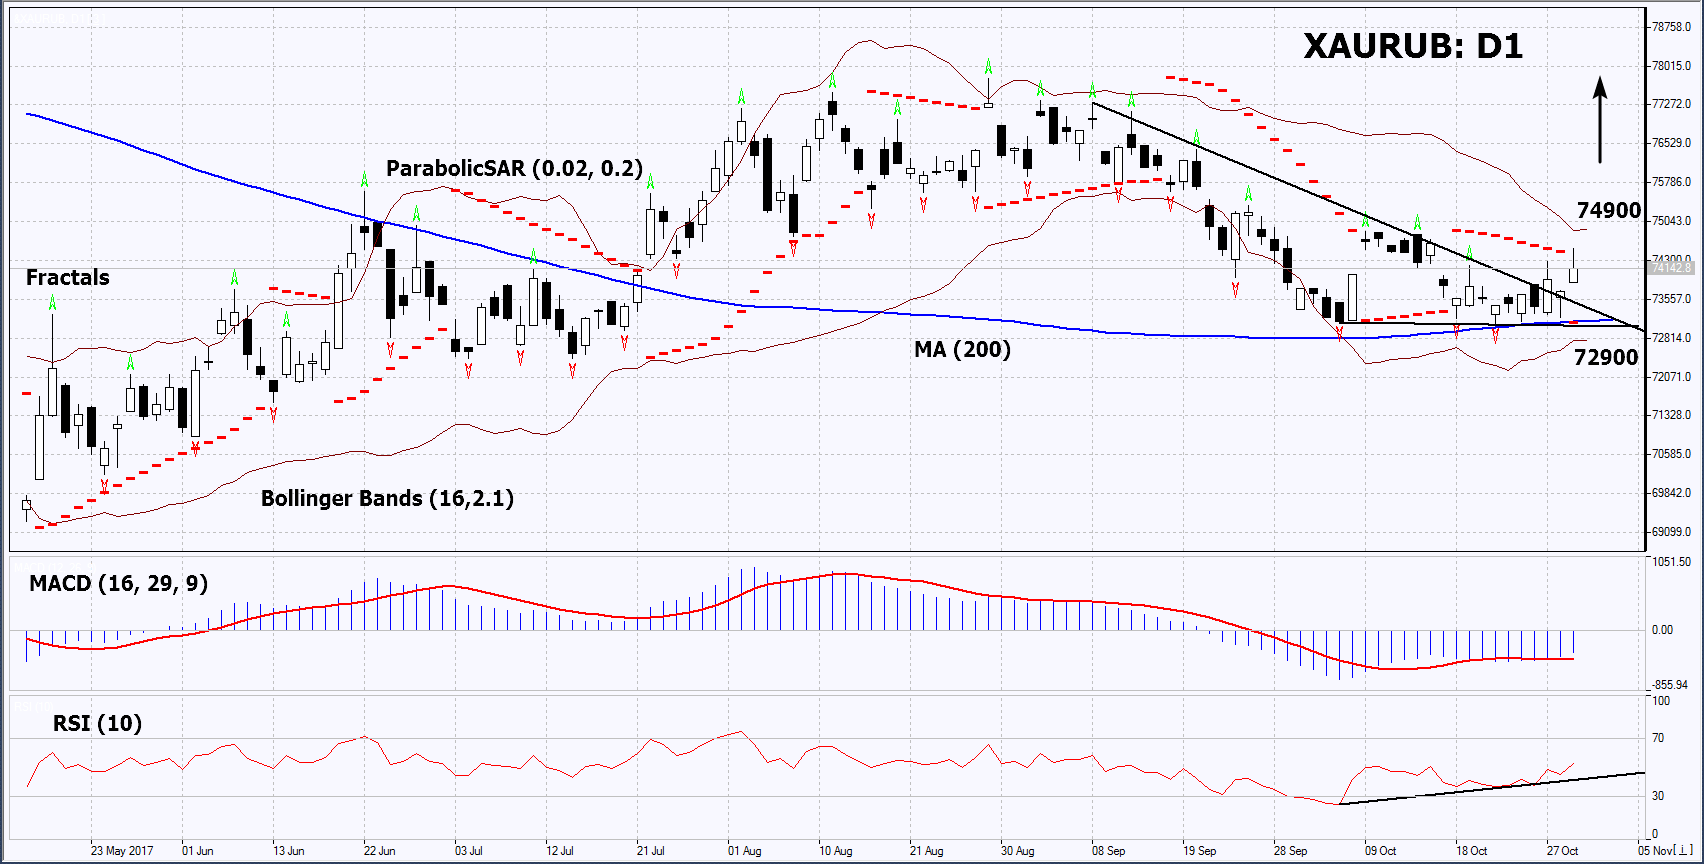
On the daily timeframe, XAURUB: D1 moved from the downward to the rising trend. Further increase is possible in case of the conflict escalation in the US, the Middle East, on the Korean peninsula, as well as in case of the further rate decrease of the Russian CB.
- The Parabolic indicator gives a bullish signal.
- The Bollinger bands have narrowed, which means lower volatility. They are tilted upwards.
- The RSI indicator is above 50. It has formed a positive divergence.
- The MACD indicator gives a bullish signal.
The bullish momentum may develop in case XAURUB exceeds the upper Bollinger band at 74900. This level may serve as an entry point. The initial stop loss may be placed below the 200-day moving average line and the Parabolic signal at 72900. After opening the pending order, we shall move the stop to the next fractal low following the Bollinger and Parabolic signals. Thus, we are changing the potential profit/loss to the breakeven point. More risk-averse traders may switch to the 4-hour chart after the trade and place there a stop loss moving it in the direction of the trade. If the price meets the stop level at 72900 without reaching the order at 74900, we recommend cancelling the position: the market sustains internal changes that were not taken into account.
Summary of technical analysis
| Position | Buy |
| Buy stop | above 74900 |
| Stop loss | below 72900 |
- Get Certificate

Note:
This overview has an informative and tutorial character and is published for free. All the data, included in the overview, are received from public sources, recognized as more or less reliable. Moreover, there is no guarantee that the indicated information is full and precise. Overviews are not updated. The whole information in each overview, including opinion, indicators, charts and anything else, is provided only for familiarization purposes and is not financial advice or а recommendation. The whole text and its any part, as well as the charts cannot be considered as an offer to make a deal with any asset. IFC Markets and its employees under any circumstances are not liable for any action taken by someone else during or after reading the overview.
