- Trading Platforms
- Platforms
- User Manuals
- NetTradeX Android User Guide
- Setting a Chart
Setting a Chart
1. Setting a chart
You can open the chart of any instrument in two ways:
- by “Chart" function from the menu bar;
- by “Chart" function from the pop-up menu, choosing the preferred instrument from the "Quotes" table.
You can move the chart right and left with a finger in the area of the chart. If to slide on the time scale, the chart will be narrower or wider depending on the movement direction. Sliding on the price scale narrows or widens the chart vertically.
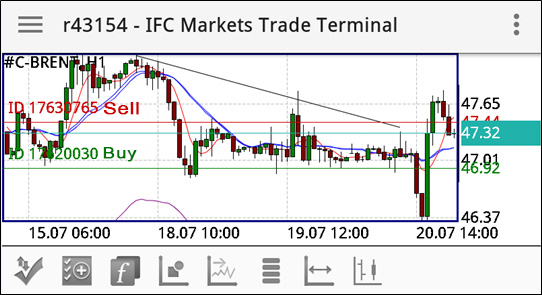
The taskbar contains 8 buttons (listed from left to right):
- The deal on the instrument of the chart;
- Setting an order on the instrument of the chart;
- Setting indicators and editing the list of indicators on the chart;
- Setting a graphical object and editing the list of objects on the chart;
- Switch for the shift of the right chart;
- The list of used instruments for choosing another instrument for the chart;
- Choosing the time frame (M1, M5, M15, M30, H1, H4, D1, W1);
- Chart types (Bars, Candles, Lines).
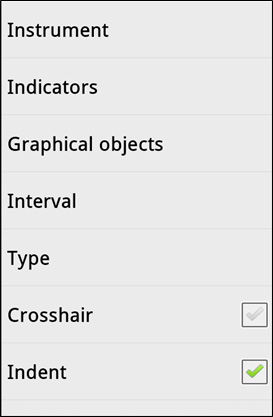
If to press the upper-right corner button (three vertically located points), the pop-up menu with 14 functions will open:
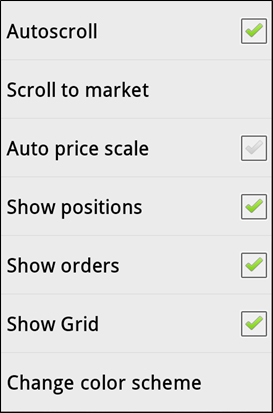
While choosing, for instance, the "Change color scheme" function, the dialog window to choose the color scheme will appear.
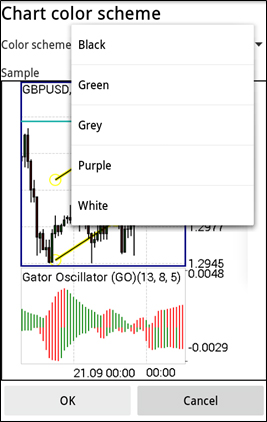
In this window you may open "Color scheme White" list and choose one of 5 schemes - "Green", for example, and press "OK". The window with example of "Green" color scheme will pop up and with "OK" button we alter the color scheme of all charts to "Green", and in case of pressing "Cancel" the current color scheme remains (in our example - "White").
2. Indicators
You can open the dialog box of setting indicators for technical analysis and can edit the set indicators by “Indicators" function of the pop-up menu on the chart:
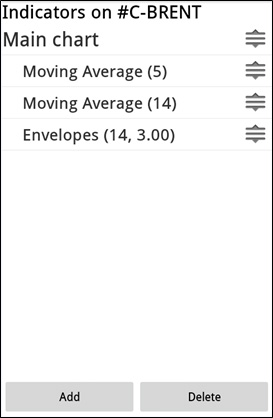
In this window you can:
- Edit the set indicators, by choosing the corresponding indicator from the list.
- Add a new indicator, by pressing the "Add" button.
A new indicator is set from the list of existing indicators, which are divided into 4 groups:
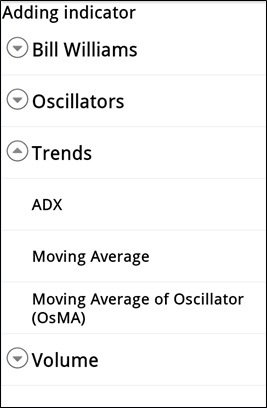
After choosing the required indicator you need to set its parameters in the dialog box (for example, for Moving Average):
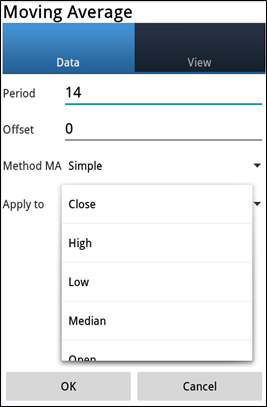
We set the indicator on the chart by "OK" button.
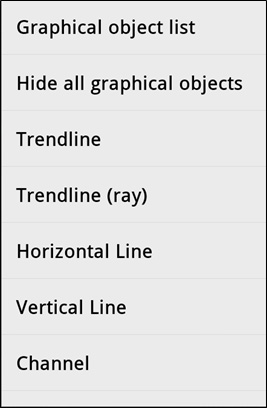
3. Graphical objects
By “Graphical objects" function of the pop-up menu on the chart you can open the dialog box for setting objects and can edit the set one:
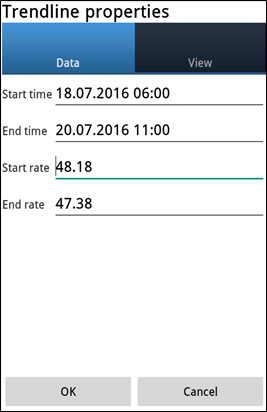
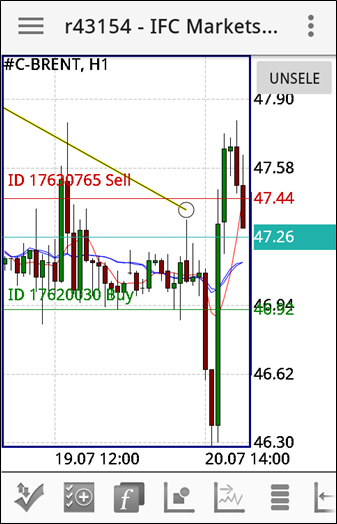
You can place the object on the chart (for example, Trendline), taking it with a finger and moving it on the chart (the object should not be selected):
By clicking on the object on the chart you can call the dialog box for editing the regime of the object and the list of objects:
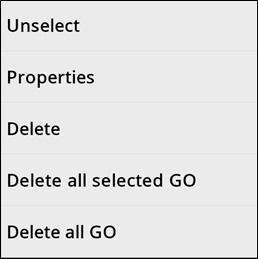
By “Properties" function you can edit the features (including the exact location) in the following dialog box: